BRIC by BRIC… the building blocks.
a brief note on the BRIC markets

Let us begin our journey looking at BRIC markets by firstly looking at how the world is doing currently using the Global 100 Index Fund ETF ($IOO) This ETF offers exposure to the global equity market through 100 of the largest companies in the world.

On May 18th, $IOO broke back above the highlighted resistance level, which also happens to coincide with the 61.8% Fibonacci retracement level measured from its ATH in Feb to low in March. $IOO has now quickly approached the 78.6% Fibonacci level, which also coincides with the next level of importance. All-time highs on the horizon?
As you can read by the title of this blog, it is about a more in-depth look into the BRIC countries. So, let us move to a look at emerging markets with the chart of the Emerging Markets ETF ($EEM). With $EEM 90% of its holdings are concentrated in the ten largest emerging markets, with its most significant weightings in Asia and Latin America. The four biggest holdings are China (29%), South Korea (15%), Taiwan (11%), and India (8%). $EEM does include the four BRIC countries that are Brazil, Russia, India, and China.

$EEM in a clear downtrend since early 2018. However, are we seeing a shift in momentum with the breakout of the highlighted level? Which also coincides with the lows in 2018 and 2019.

Relative to the S&P 500 $EMM has been decade long downtrend, and on the short-term picture, it does not look like it is getting any better.
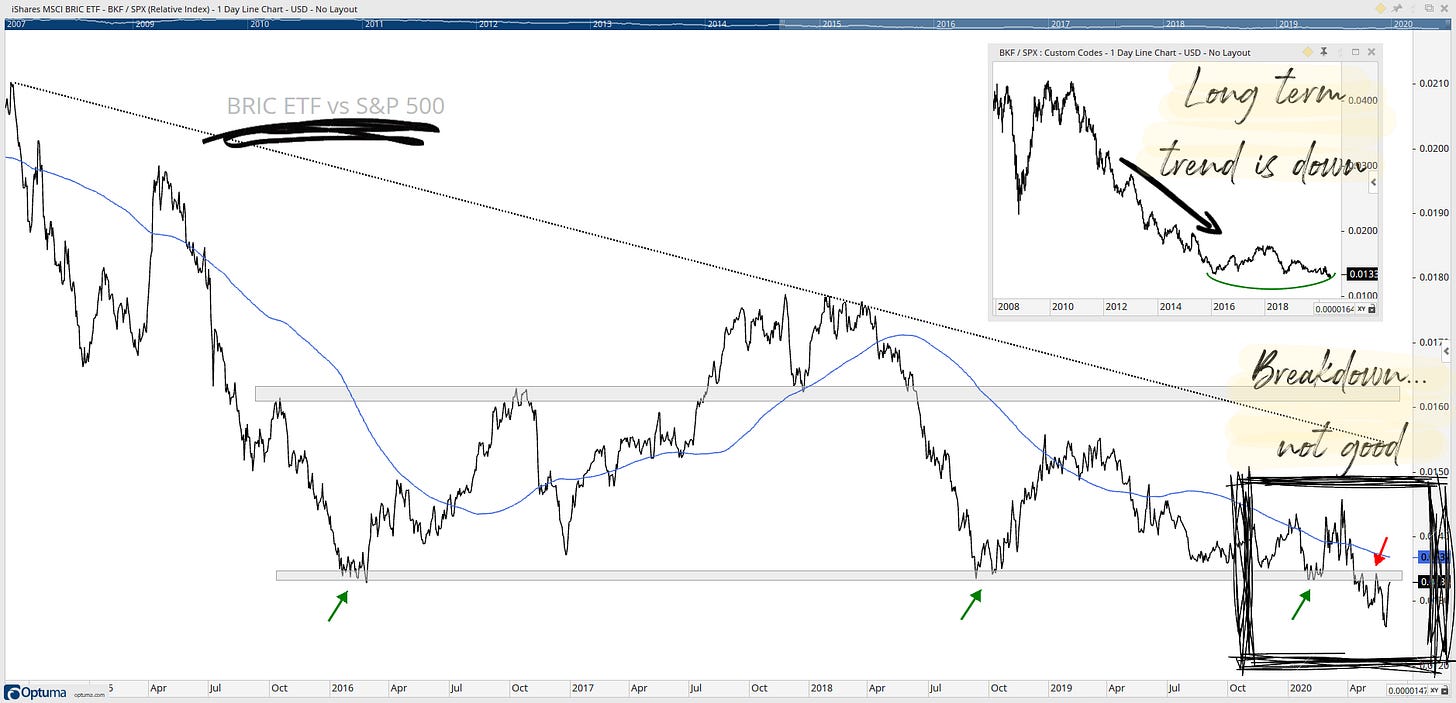
Now let us get onto the BRIC’s. First, we will look at the BRIC Index Fund ($BKF), which offers exposure to those four large emerging markets by themselves. The four holdings are China (54%), India (18%), Brazil (17%), and Russia (9%).

$BKF is currently testing its 61.8% Fibonacci retracement level from 2020 January high to the March low. However, I see the real test for $BKF is around the $44 area, which coincides with the 78.6% Fibonacci level and the highlighted well-tested support and resistance zone.

Relative to the S&P 500 $BKF longer-term picture has been in a downtrend. However, in the past few years it looks to be forming a base, but when you drill down to the shorter-term picture, you can see that it has broken out below the support level.
Looking a little deeper into the BRIC countries, Brazil ($EWZ) was a ranging market between $31 to $48 for the past four years until it broke out of that range in early March 2020 then it found a base around $20. $EWZ price is back to and testing the support zone of the 4-year range, which also coincides with the 38.2% Fibonacci retracement level. $EWZ the hardest hit with a drop of 58% from January 2020 peak.

$EWZ still below 200SMA.
RSI re-entered bullish range.
Long and short-term relative weakness
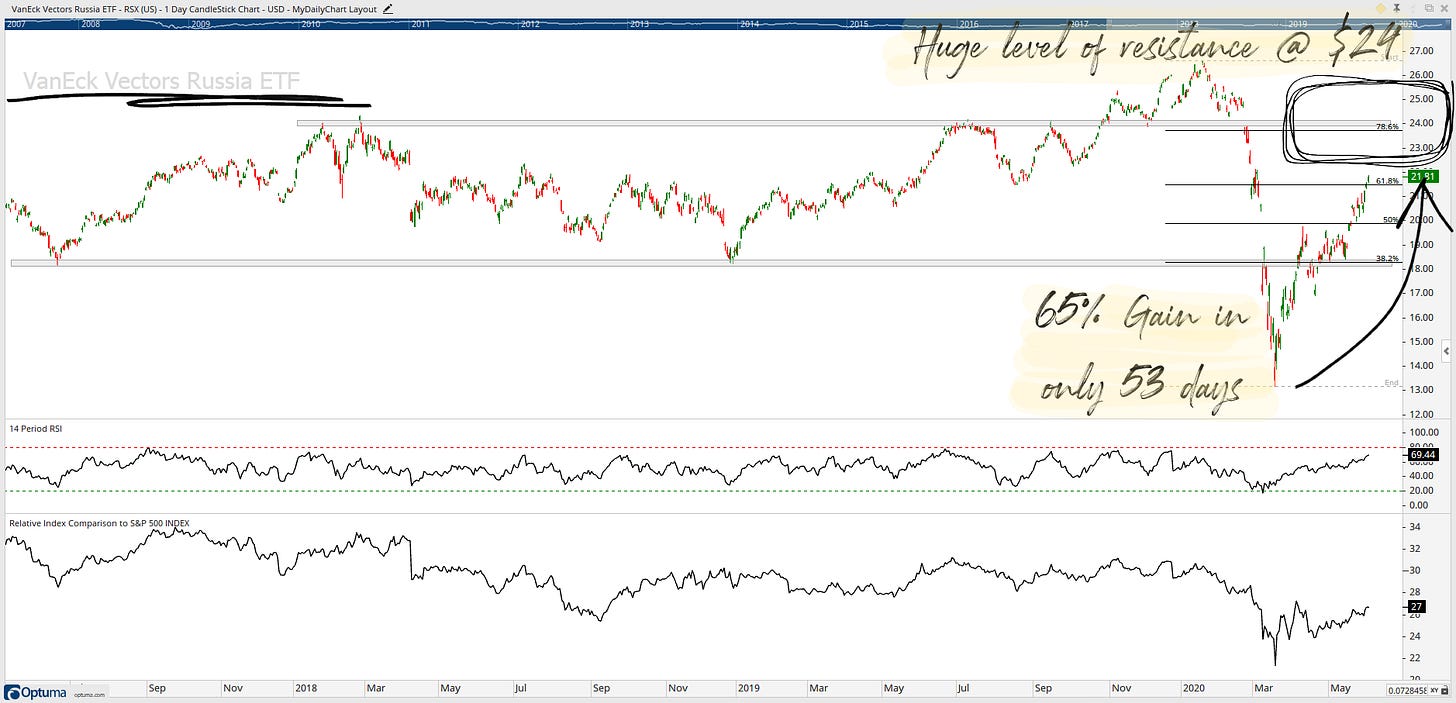
Russia ($RSX) has gained 65% off its March lows in only been 53 days and is currently testing the 61.8% Fibonacci level ($21.50). $RSX has been the best % performing ETF of the four. However, I see more testing resistance at the 78.6% Fibonacci level ($24 area), which coincides with a well-tested support and resistance zone.

$RSX still below 200SMA.
RSI bullish range, would like it to cross 70.
Long and short-term relative weakness
India ($INDA) recently broke past the 50% Fibonacci level with strong momentum (41% gain in 50 days) and is now testing the 2018 low ($29)

$INDA below 200SMA.
RSI bullish range, would like it to cross 70.
Long and short-term relative weakness
China ($MCHI) testing the 78.6% Fibonacci level and in the middle of the actively tested highlighted support and resistance zone. If $MCHI can clear this area, the next level would be the 127% Fibonacci level and then all-time highs.

$MCHI above 200SMA.
RSI is in bullish range but did not get oversold during 2020 crash.
Bottom Line: All BRIC ETF’s have had constructive moves off March lows. However, each ETF will have challenging times on the horizon with well-supported levels of resistance coming. Keep an eye on these charts tho!

Stay safe and good luck out there…
GH
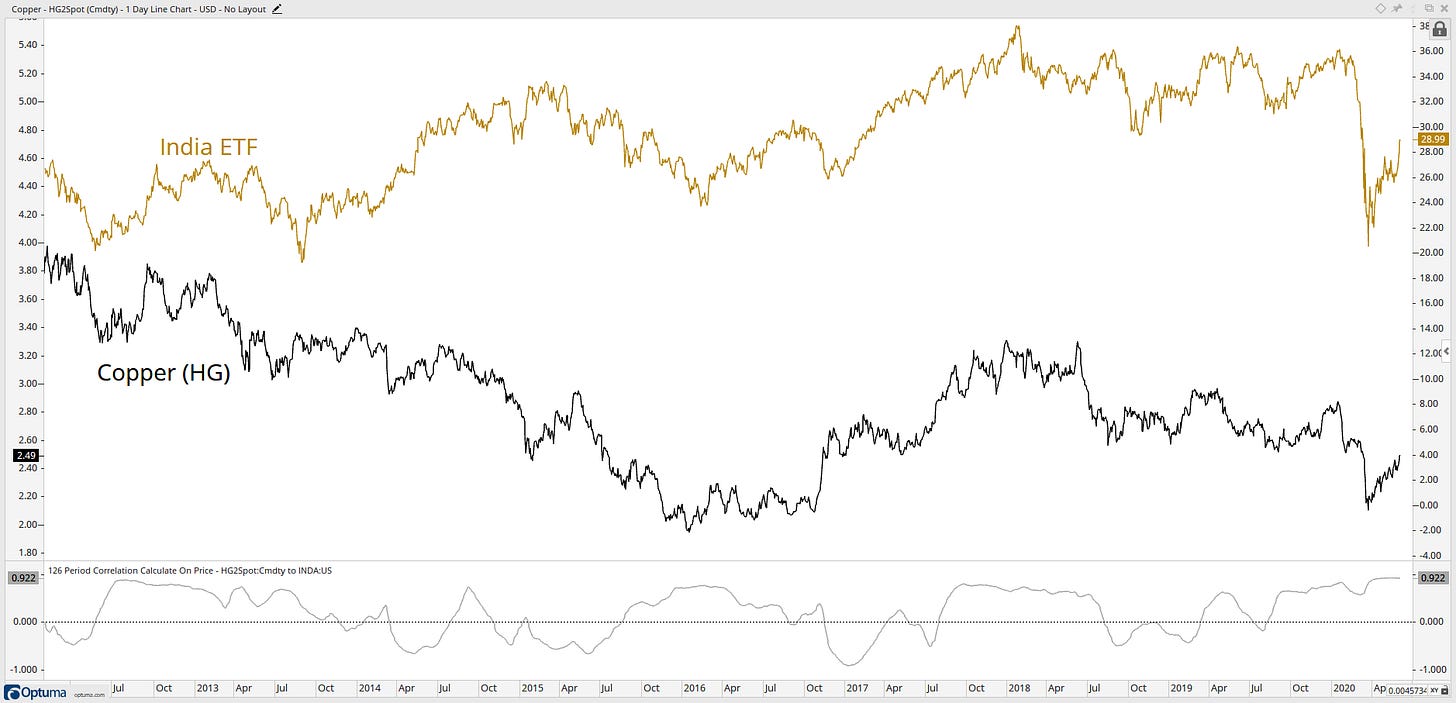
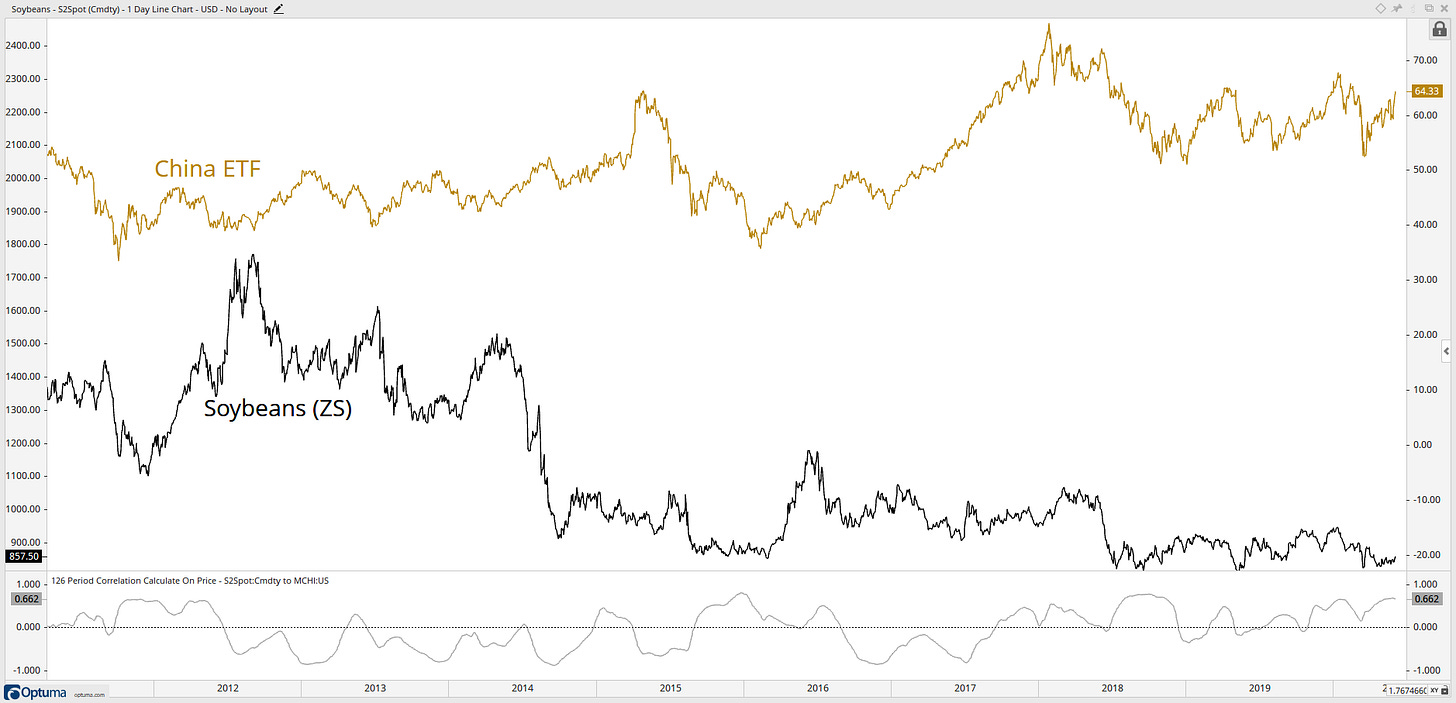
Additional charts:


DISCLAIMER: The information included in this report are obtained from sources which Jotting on Charts believes to be reliable, but we do not guarantee its accuracy. All of the information contained herein should be independently verified and confirmed. Jotting on Charts is not a financial advisor and this does not constitute investment advice nor any opinions expressed, constitute a solicitation of the purchase or sale of any securities or related financial instruments. Jotting on Charts is not responsible for any losses incurred from any use of this information. Do not trade with money you cannot afford to lose. It is recommended that you consult a qualified financial advisor before making any investment decisions.

