Welcome to Jotting on Charts. If you’re reading my blog but haven’t subscribed, please join to learn more about uptrends, downtrends and everything in between alongside +500 other subscribers. Thank you to all who are following along on this journey!
If you share this with 2 of your friends who also like to look at charts, it will be GREATLY appreciated. Thank you to all those who share.
Welcome back everyone!
It’s been a minute since I last posted a blog, and I felt like I wanted to write again… This might be a bit rusty, so please bear with me! :D But let’s get to it…
Most people know if you are following me over on X, I like to know what environment we are in when allocating capital into the market.
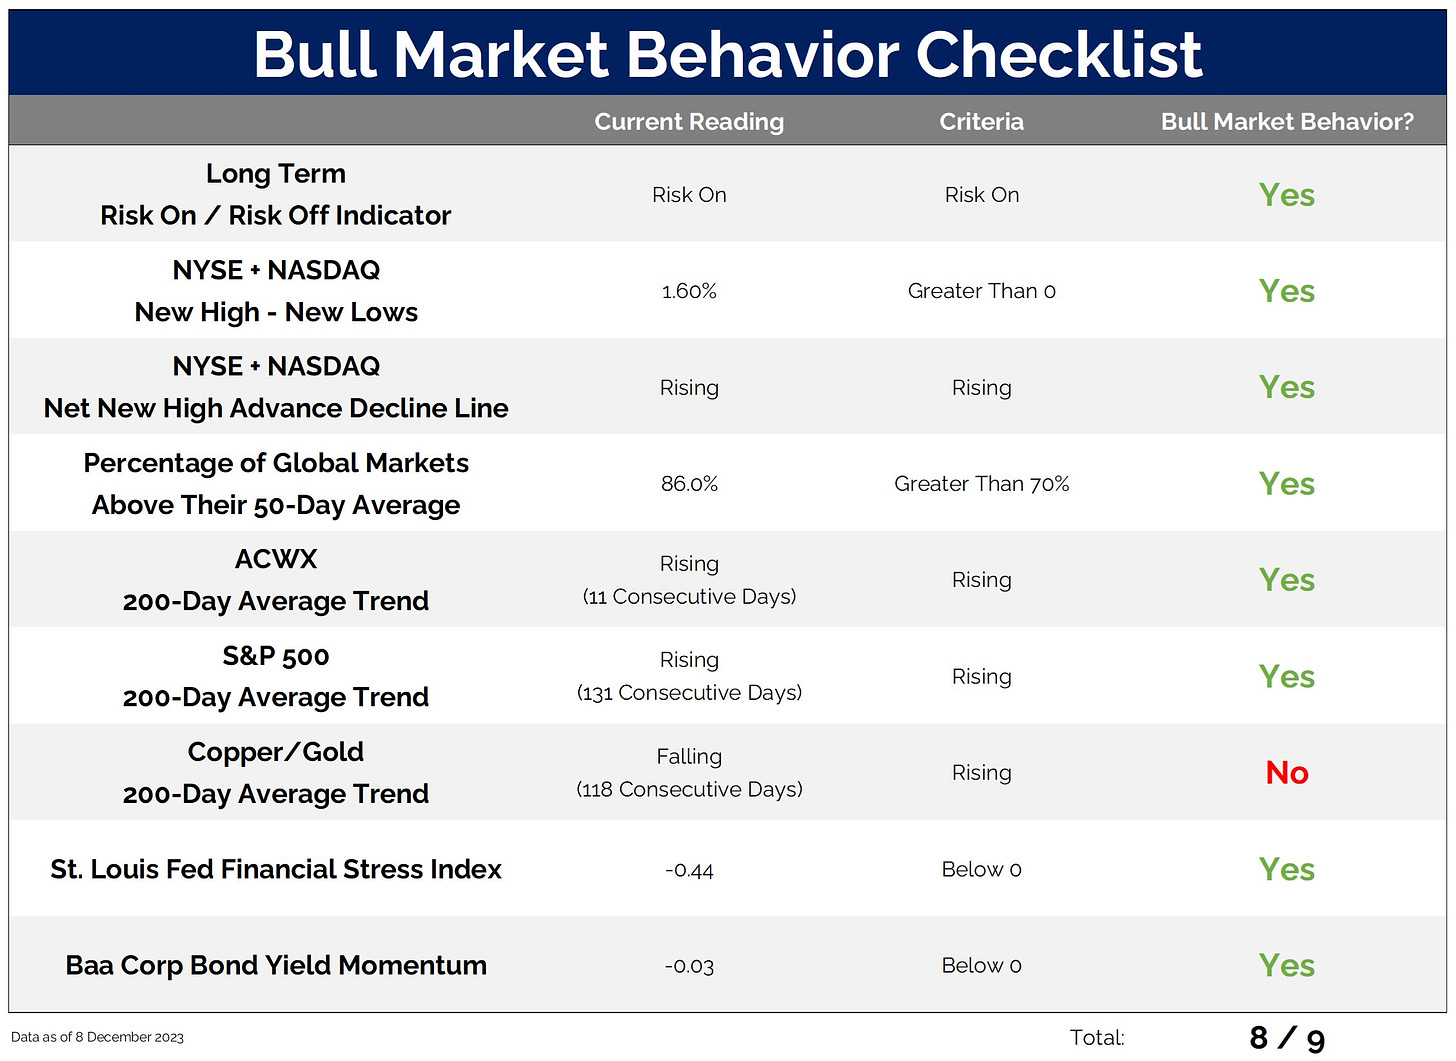
So, I constructed a bull market behavior checklist.
This checklist is a mix of breadth, price & macro’ish indicators, which is designed to show turns toward risks (bear market) or opportunities (bull market).
I use a mix of US and global market data and throw in a sprinkle of macro data. I do this because I like to have a bird’s eye view and not be focused only on one area of the market.
These indicators I use are not signals as such but more so measures that reflect the type of environment in which we are currently trading.
Right now, my checklist is indicating a healthy bull market:
We have eight out of nine indicators flashing green…
So yes, we are in a bull market.
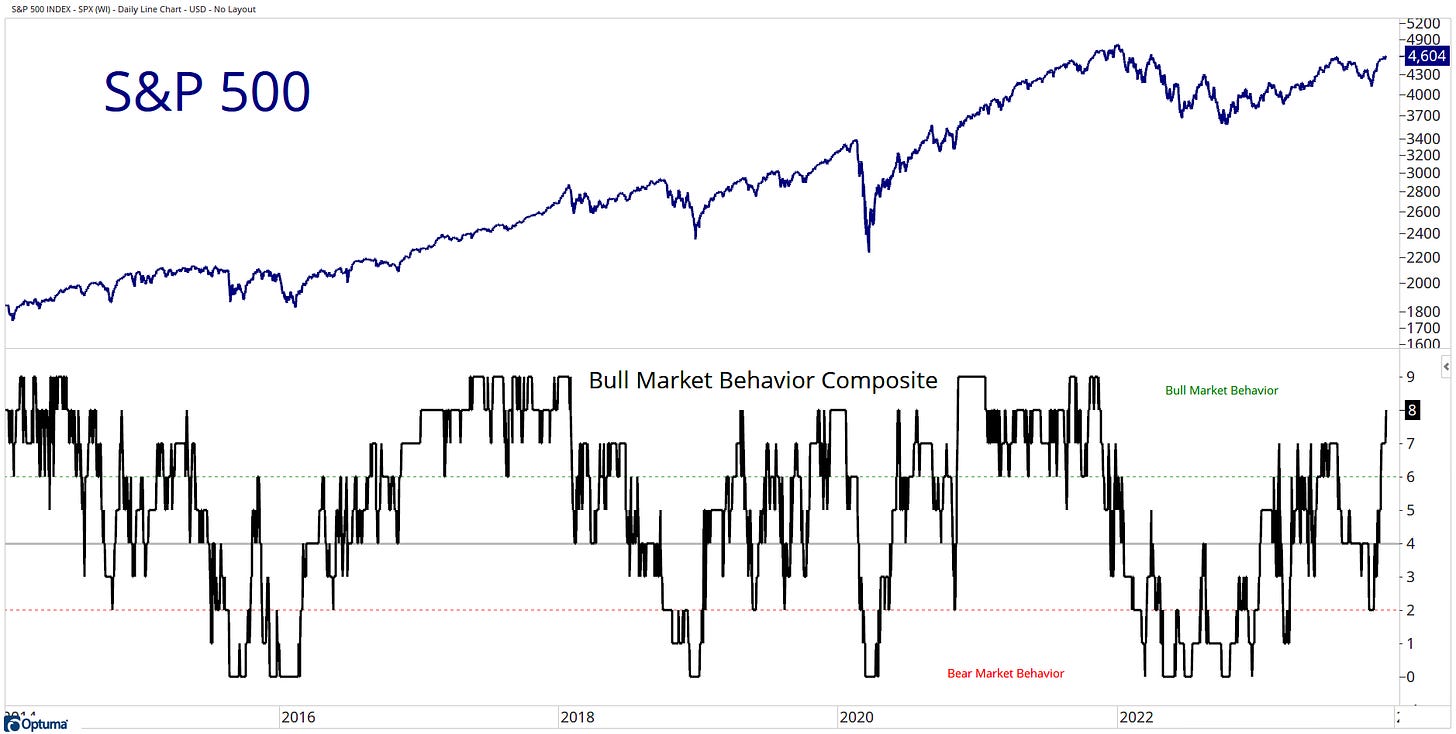
It’s the highest reading in over two years:
The last time we saw eight out of nine was back on November 15th, 2021.
So, the bull market is in full effect!
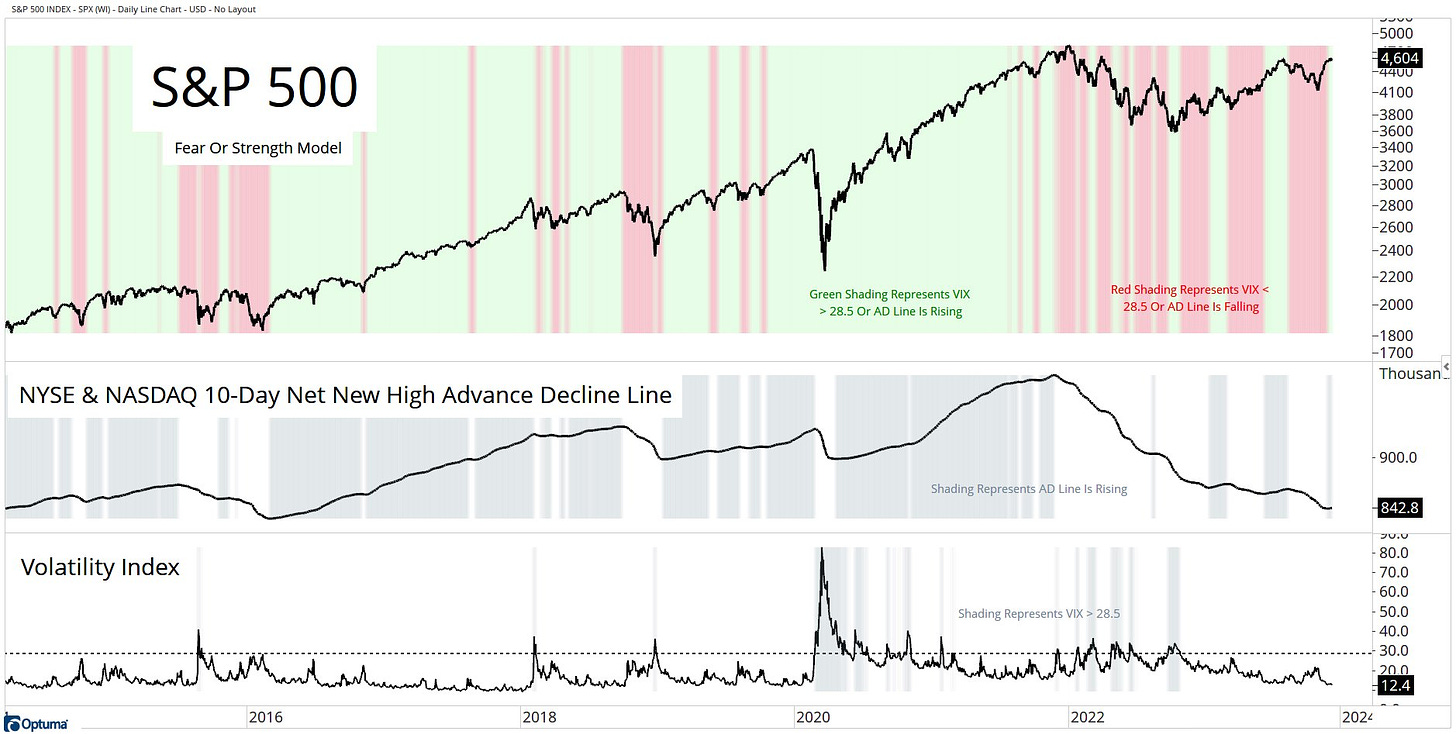
This increase in bull market activity coincides with the firing of two of my favourite signal indicators.
The Fear or Strength model has turned positive:
Shout-out Willie Delwiche
We also have entered a Breadth Thrust Regime (When 55% or more of the S&P 500 stocks are at 20-day highs):
Shout-out RenMac
By the way, this regime lasts one year!
All this data is bullish…
Are you paying attention to this data?
The environment HAS changed…
So I have changed my view!
and…
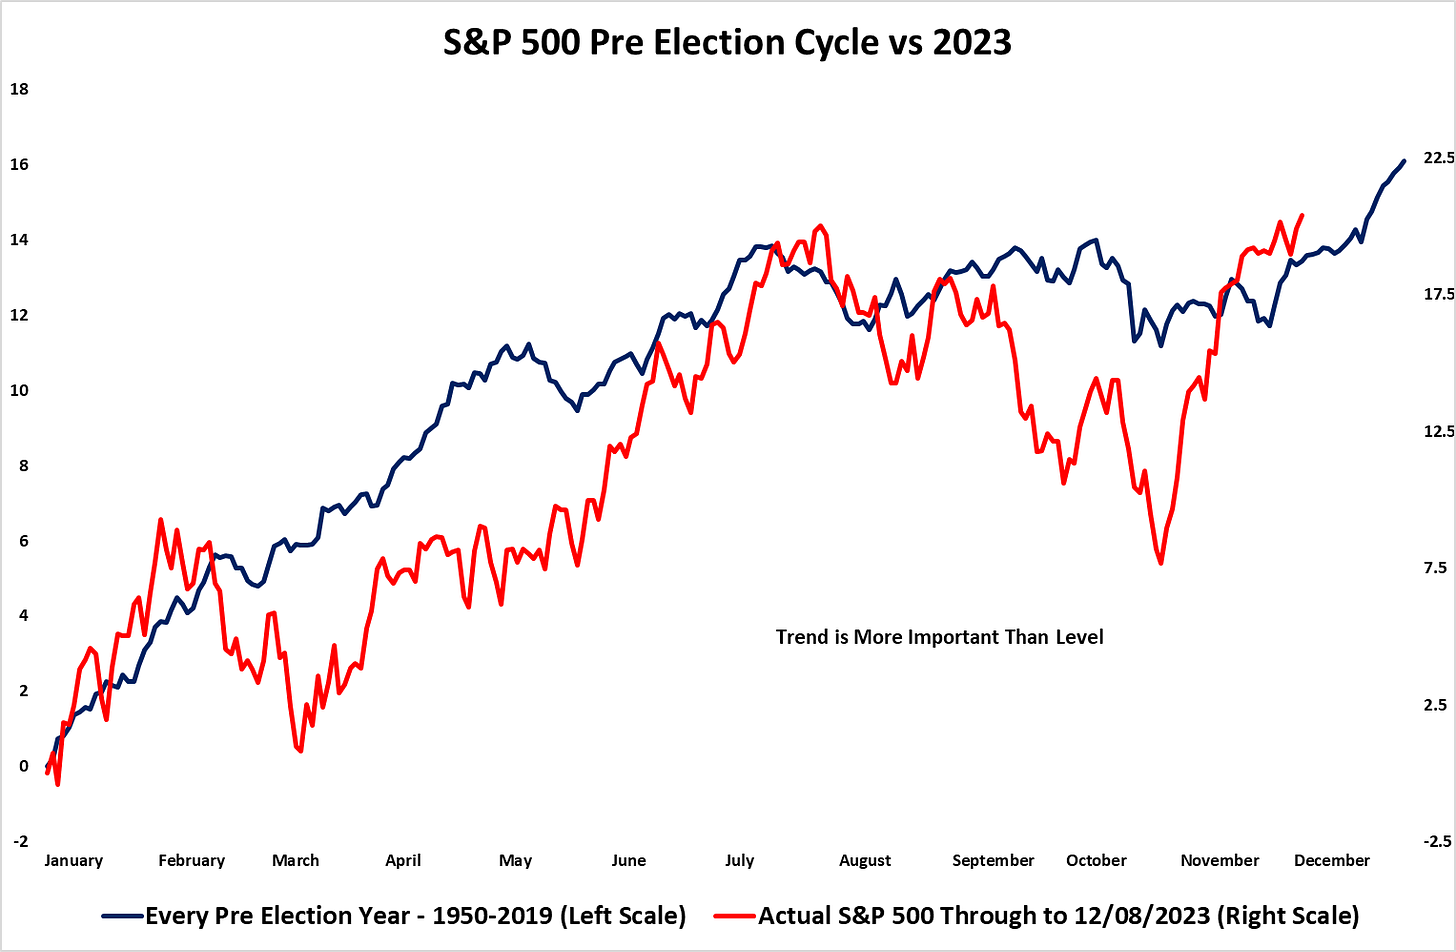
With only a few weeks remaining in 2023, the current cycle trend is following the pre-election cycle down to a tee:
More upside? Maybe…
Santa rally is incoming too…
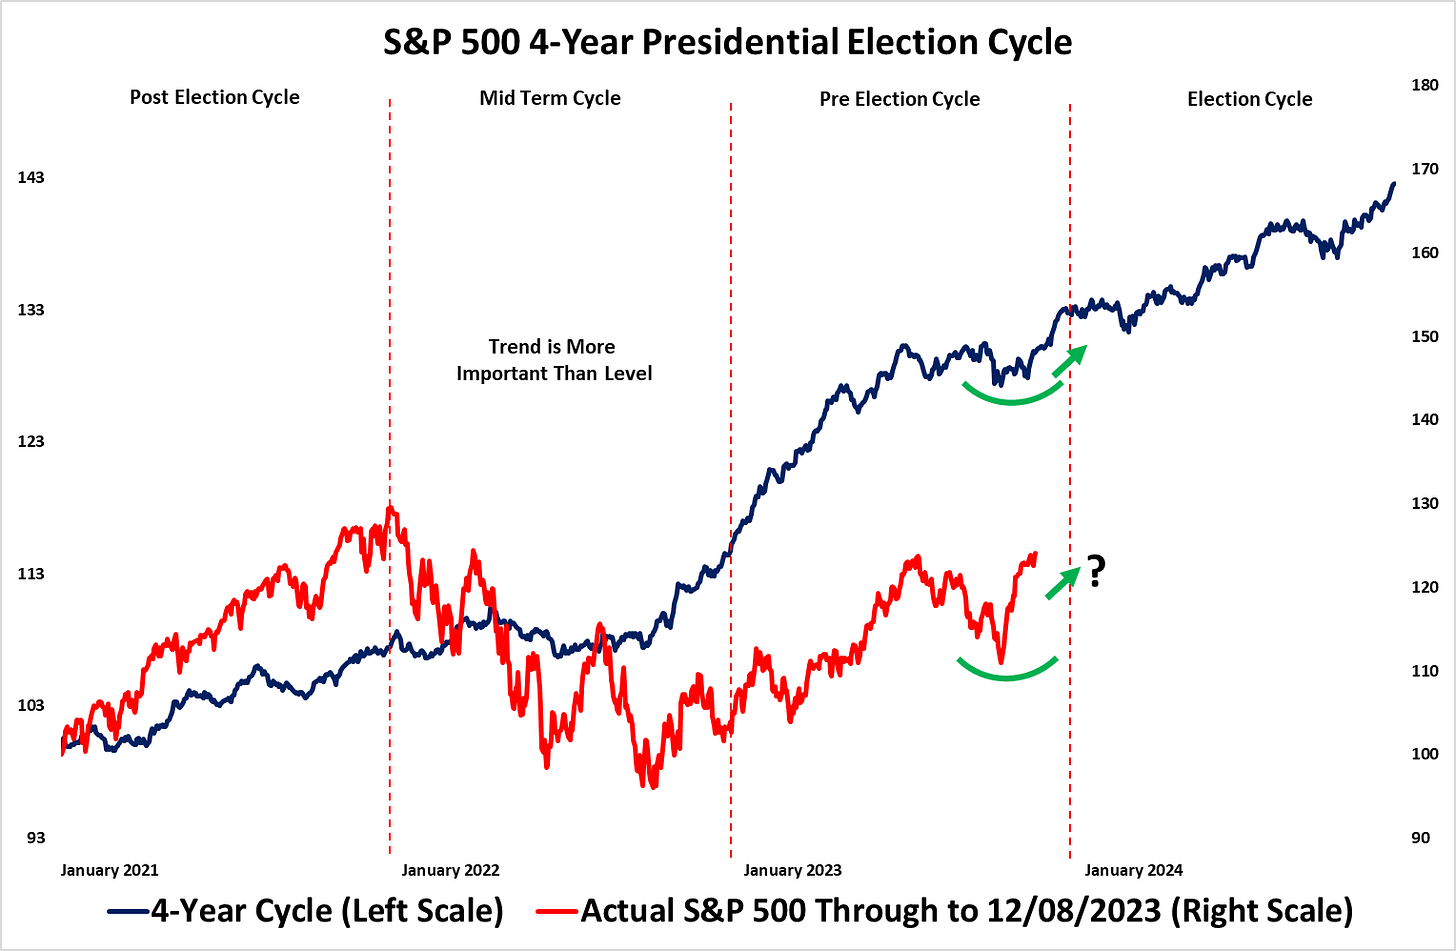
But what about 2024?… Here is a look at the entire cycle:
Will we see a similar trend correlation in 2024?
What do you think?
Time will tell...
I’ll just be here following the data!
If you enjoyed this post, please consider sharing it for more people to see!
As always, stay safe and good luck out there…
Please reach out with any questions…
GH
DISCLAIMER: The information included in this report are obtained from sources which Jotting on Charts believes to be reliable, but we do not guarantee its accuracy. All of the information contained herein should be independently verified and confirmed. All opinions expressed by Jotting on Charts are for informational purposes only. Jotting on Charts is not a financial advisor. This does not constitute investment advice, nor any opinions expressed, constitute a solicitation of any securities or related financial instruments' purchase or sale. Jotting on Charts is not responsible for any losses incurred from any use of this information. Do not trade with money you cannot afford to lose. It is recommended that you consult a qualified financial advisor before making any investment decisions.

