Checking in on the US market breadth
Peeking under the hood!
I have noticed a few people posting their thoughts about the market breadth, and I wanted to jump in and give you my thoughts about the current environment.
I have been talking about breadth thrusts happening all over US indices and sectors for months now.
The evidence has been clear. The breadth within the US markets has been overwhelmingly bullish.
This is one of the main reasons I have been in the camp that this is likely the early innings of a new cyclical bull market.
That brings us to today’s update.
Let’s take a peek at how the US markets breadth is currently looking.
The first chart is a custom indicator that looks at the GICS S&P large-, mid- & small-cap industry groups (Total of 72 industry groups)
The indicator looks for the following.
Is the 10- and 40-week simple moving average in an up-slope?
Is the current price above or below the 10- and 40-week simple moving average?
Currently, 88% of these industry groups are in an uptrend, and we are seeing continued support around the 50% level, which is showing us the strength within the US market.
Now, let’s split the universe into market cap levels.
We can see that mid-cap are holding up the best with 96% of its industry groups are in an uptrend… followed by large-cap with 92% and small-cap industry groups are the current laggards at a still reasonable 75%.
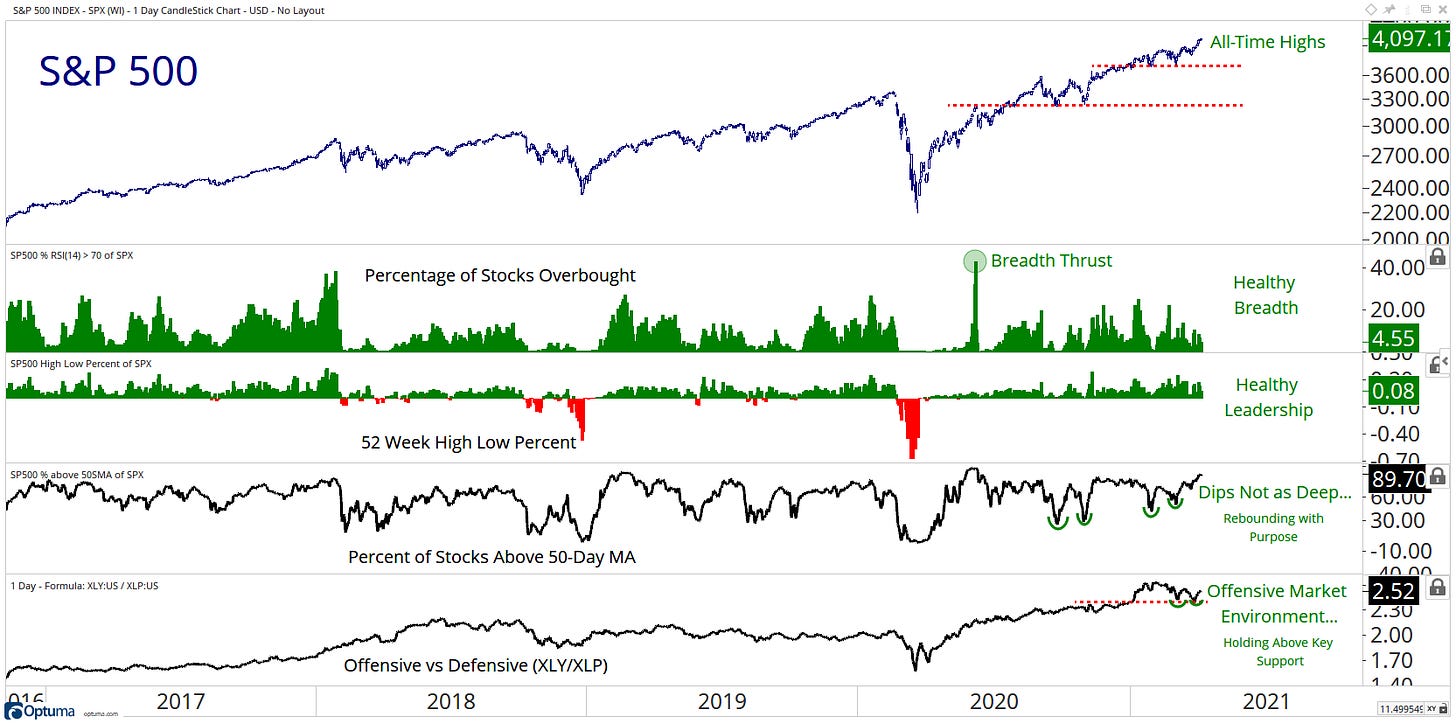
Let’s look at the S&P 500…
I can’t get bearish on the S&P 500 yet… here are my notes:
Clear as day stair-stepping uptrend and price is currently at all-time highs…
Breadth is within healthy readings…
Leadership continues to be strong…
Dips are less deep over the past year…
Still in an offensive market environment as the XLY/XLP ratio is above support…
When we see such strong breadth, I like to move down and take a look at the lower timeframes to see if we are getting any expansions in the new lows.
These are the areas we will first see the signs of the beginning of market declines, and currently, these lower time frames are not showing any signs of weakness.
Moving across to the growth/tech-heavy index of the NASDAQ 100
Here are my notes on why I am not bearish yet:
Seeing standard consolidation above critical short term support…
Breadth has been fading but not falling away…
Leadership has also been fading but not showing weakness yet…
Dips are rebounding, showing there is still strength…
Growth vs Value ratio broke short-term support but didn’t fall off a cliff…
Even though we have seen the NASDAQ 100 market pull back from its recent highs, we are not witnessing any exploding expansions within the new low on the smaller time frames.
So, in conclusion, while we see these healthy leadership readings and breadth thrusts, we need to be constantly mindful of the bigger picture. There are still plenty of signs and intermarket signals that suggest the US equity market is just in the early innings of a new bull cycle.
So, my question to you… Do you think we are in early innings of a new bull cycle?
Or am I completely wrong here?
Let me know your thoughts in the comment section or get in contact with me on Twitter @granthawkridge.
If you enjoyed this blog, please consider sharing for more to see!
Stay safe, and good luck out there…
GH
DISCLAIMER: The information included in this report are obtained from sources which Jotting on Charts believes to be reliable, but we do not guarantee its accuracy. All of the information contained herein should be independently verified and confirmed. All opinions expressed by Jotting on Charts are for informational purposes only. Jotting on Charts is not a financial advisor. This does not constitute investment advice, nor any opinions expressed, constitute a solicitation of any securities or related financial instruments' purchase or sale. Jotting on Charts is not responsible for any losses incurred from any use of this information. Do not trade with money you cannot afford to lose. It is recommended that you consult a qualified financial advisor before making any investment decisions.


Great, same here, as I think the commodity has much more room to go up comparing to the bonds