


Infocus - Online Retail
a deeper look into an industry


The idea of this post is to show you how I look at the markets with a top-down approach. I hopefully will post once a week “Infocus” posts that will be looking at different industries that may help us discover trends or breakouts we have missed in our daily scan of the markets.
Today’s Infocus I will be delving into Online Retail.
Let us begin our journey by looking at the sector level - Consumer Discretionary.

Consumer Discretionary fell 38% during the COVID crash. However, it only took two months to regain its losses and now it continues to make new all-time highs.

Consumer Discretionary started to underperform relative to the S&P 500 from September 2019. However, Consumer Discretionary found a support level which dated back to March 2015 and since then has been outperforming relative to the S&P 500.
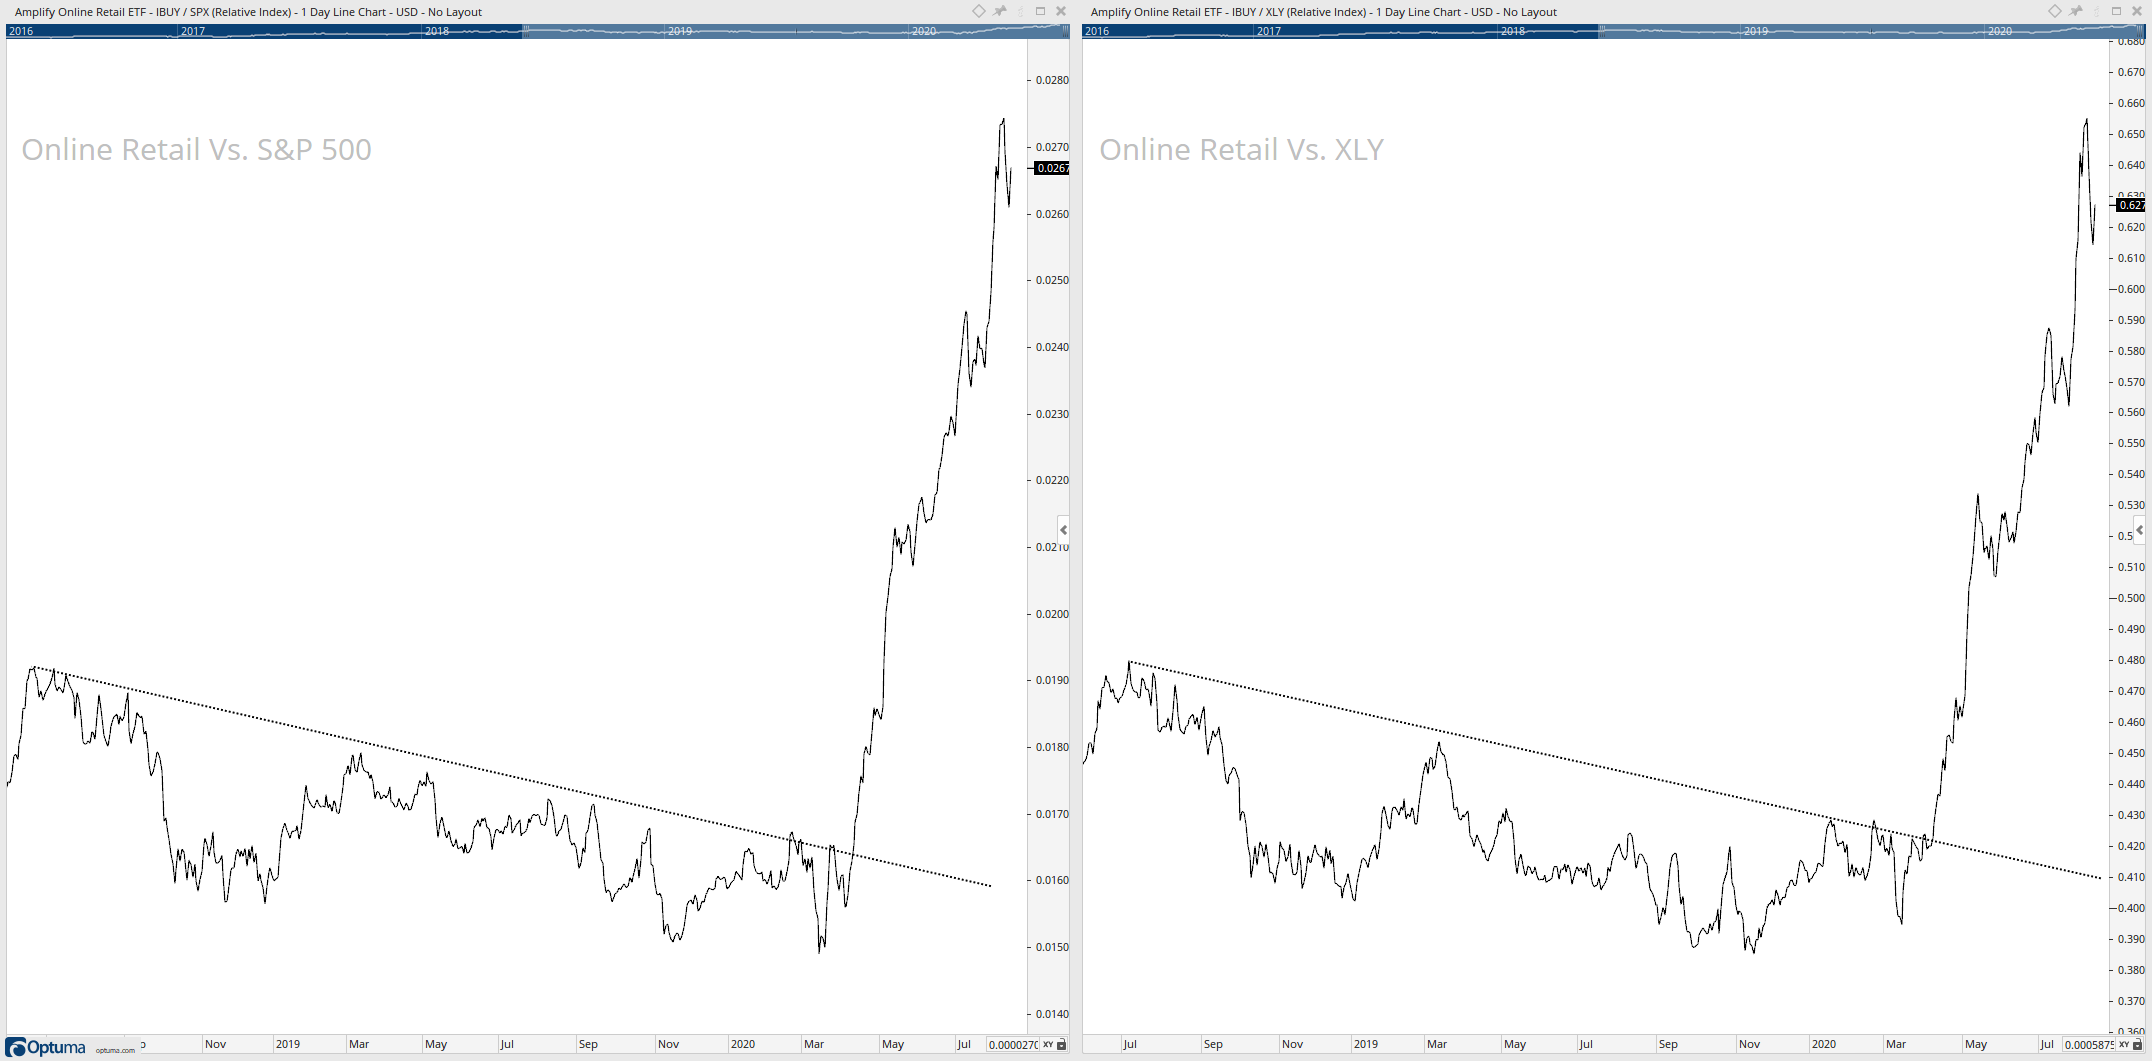
Moving onto the relative performing of the Online Retail ETF, you can see it has been outperforming the S&P 500 and Consumer Discretionary in 2020 after a big break of both downtrends at the start of April. The Online Retail ETF is up 75.34% YTD vs. 14.50% for Consumer Discretionary and 4.42% for the S&P 500.

Now looking at the Online Retail ETF, you can see it’s just been ripping to the upside. It only took a month to regain its losses from the COVID crash in March and is now testing its 261.8% Fibonacci extension level.
Five winners in the current online retail environment
Despite the enormous effects of COVID19 for the broader market, these five companies withstood the weakness and just ripped higher: FVRR, W, SHOP, OSTK, PTON

YTD Performance:
FVRR - 380%
W - 237%
SHOP - 145%
OSTK - 1,249%
PTON - 120%

The above chart is a Relative Rotation Graphs, and it shows each stock’s weekly relative strength and momentum relative to the Consumer Discretionary sector.
There are four quadrants on the Relative Rotation Graphs chart:
Leading (Green) - strong relative strength and strong momentum
Weakening (Yellow) - strong relative strength but weakening momentum
Lagging (Red) - weak relative strength and weak momentum
Improving (Blue) - weak relative strength but improving momentum
The stocks are showing some weakness with movement towards the weakening quadrat after strong performance relative to the Consumer Discretionary sector.
Fiverr

Fiverr has been taking out level after level to the upside, however, recently finding some resistance at the 685.4% Fibonacci extension level. The key level I am watching to hold as support is around the $75 region.
Wayfair
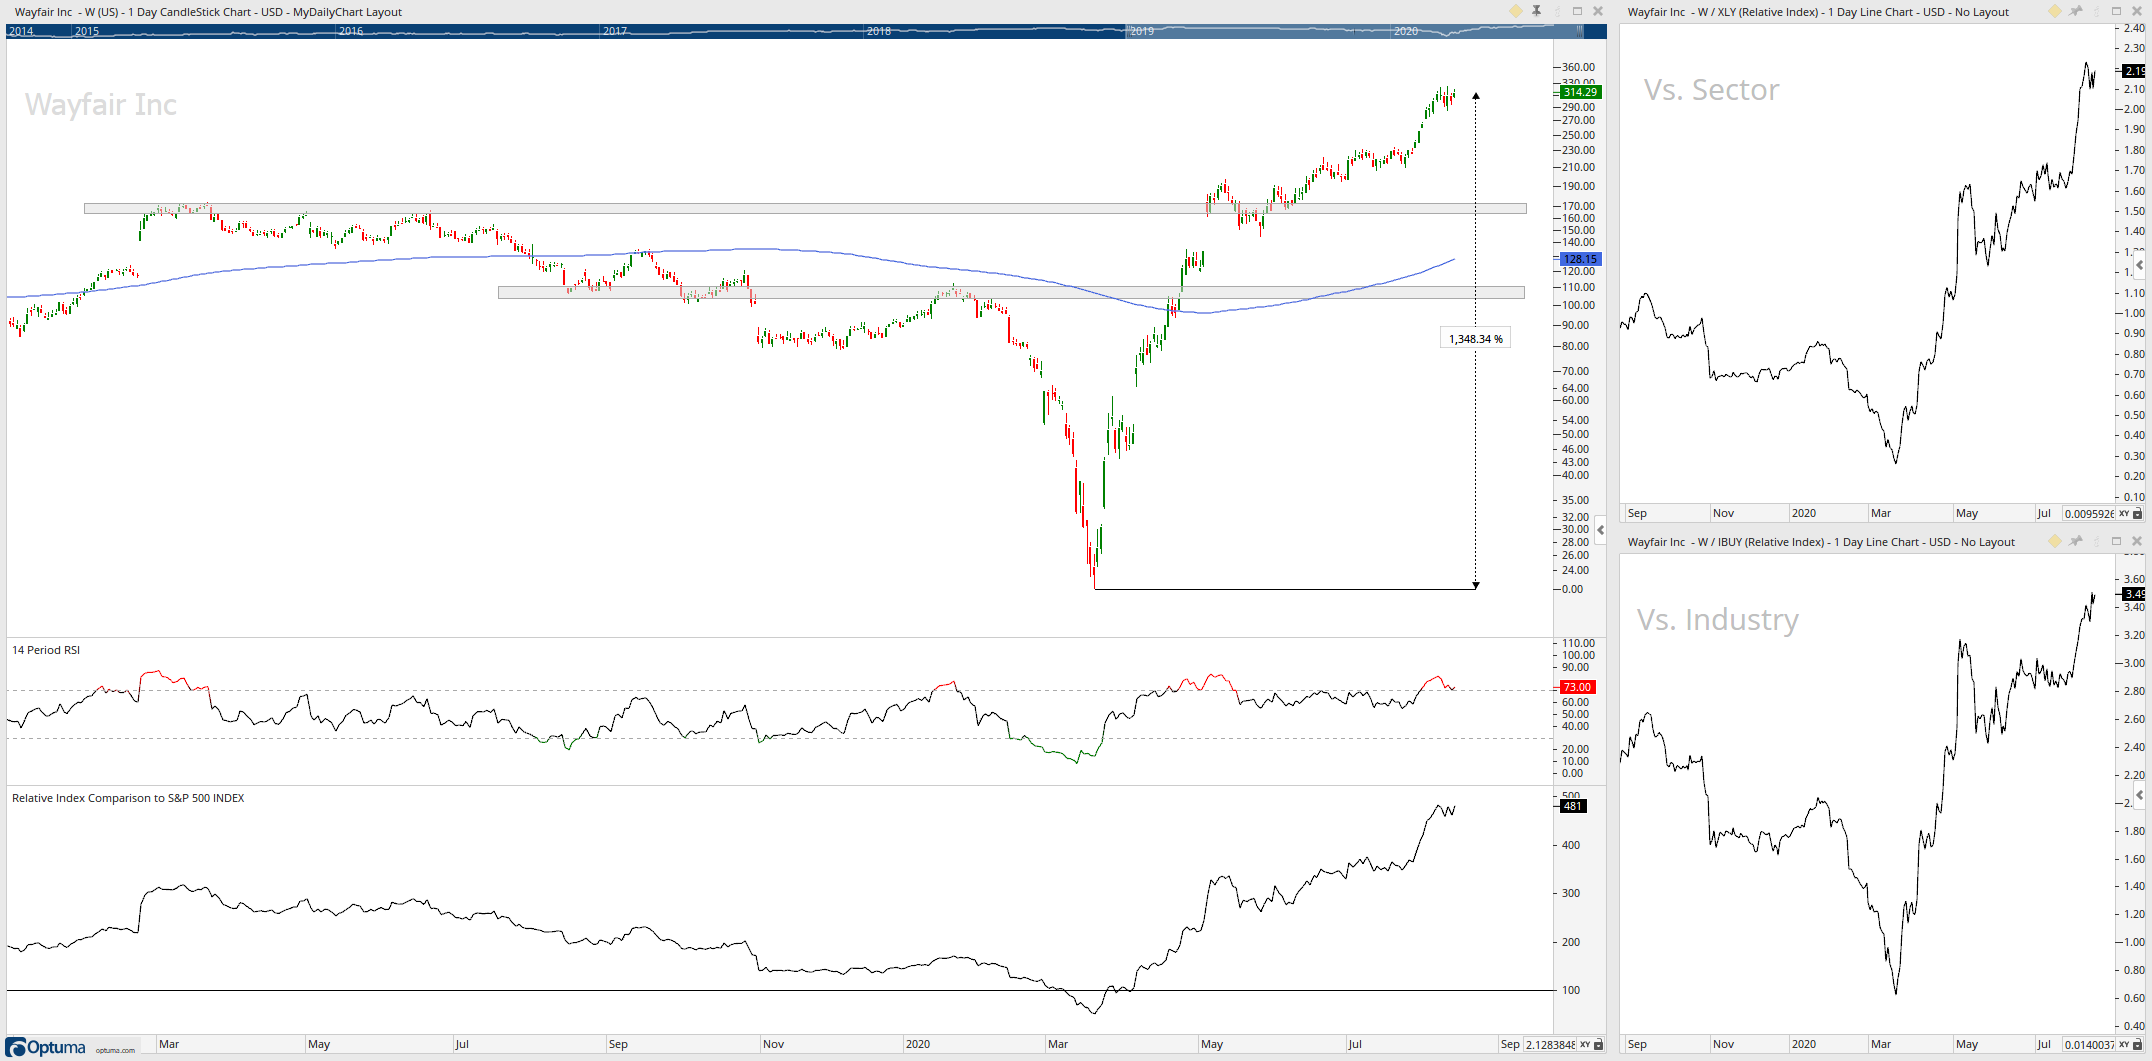
Wayfair has had one mission since finding support from the COVID crash, and that is ripping to the upside with a massive 1348% performance gain and new all-time highs. The key level I am watching to hold as support is around the $170 region.
Shopify
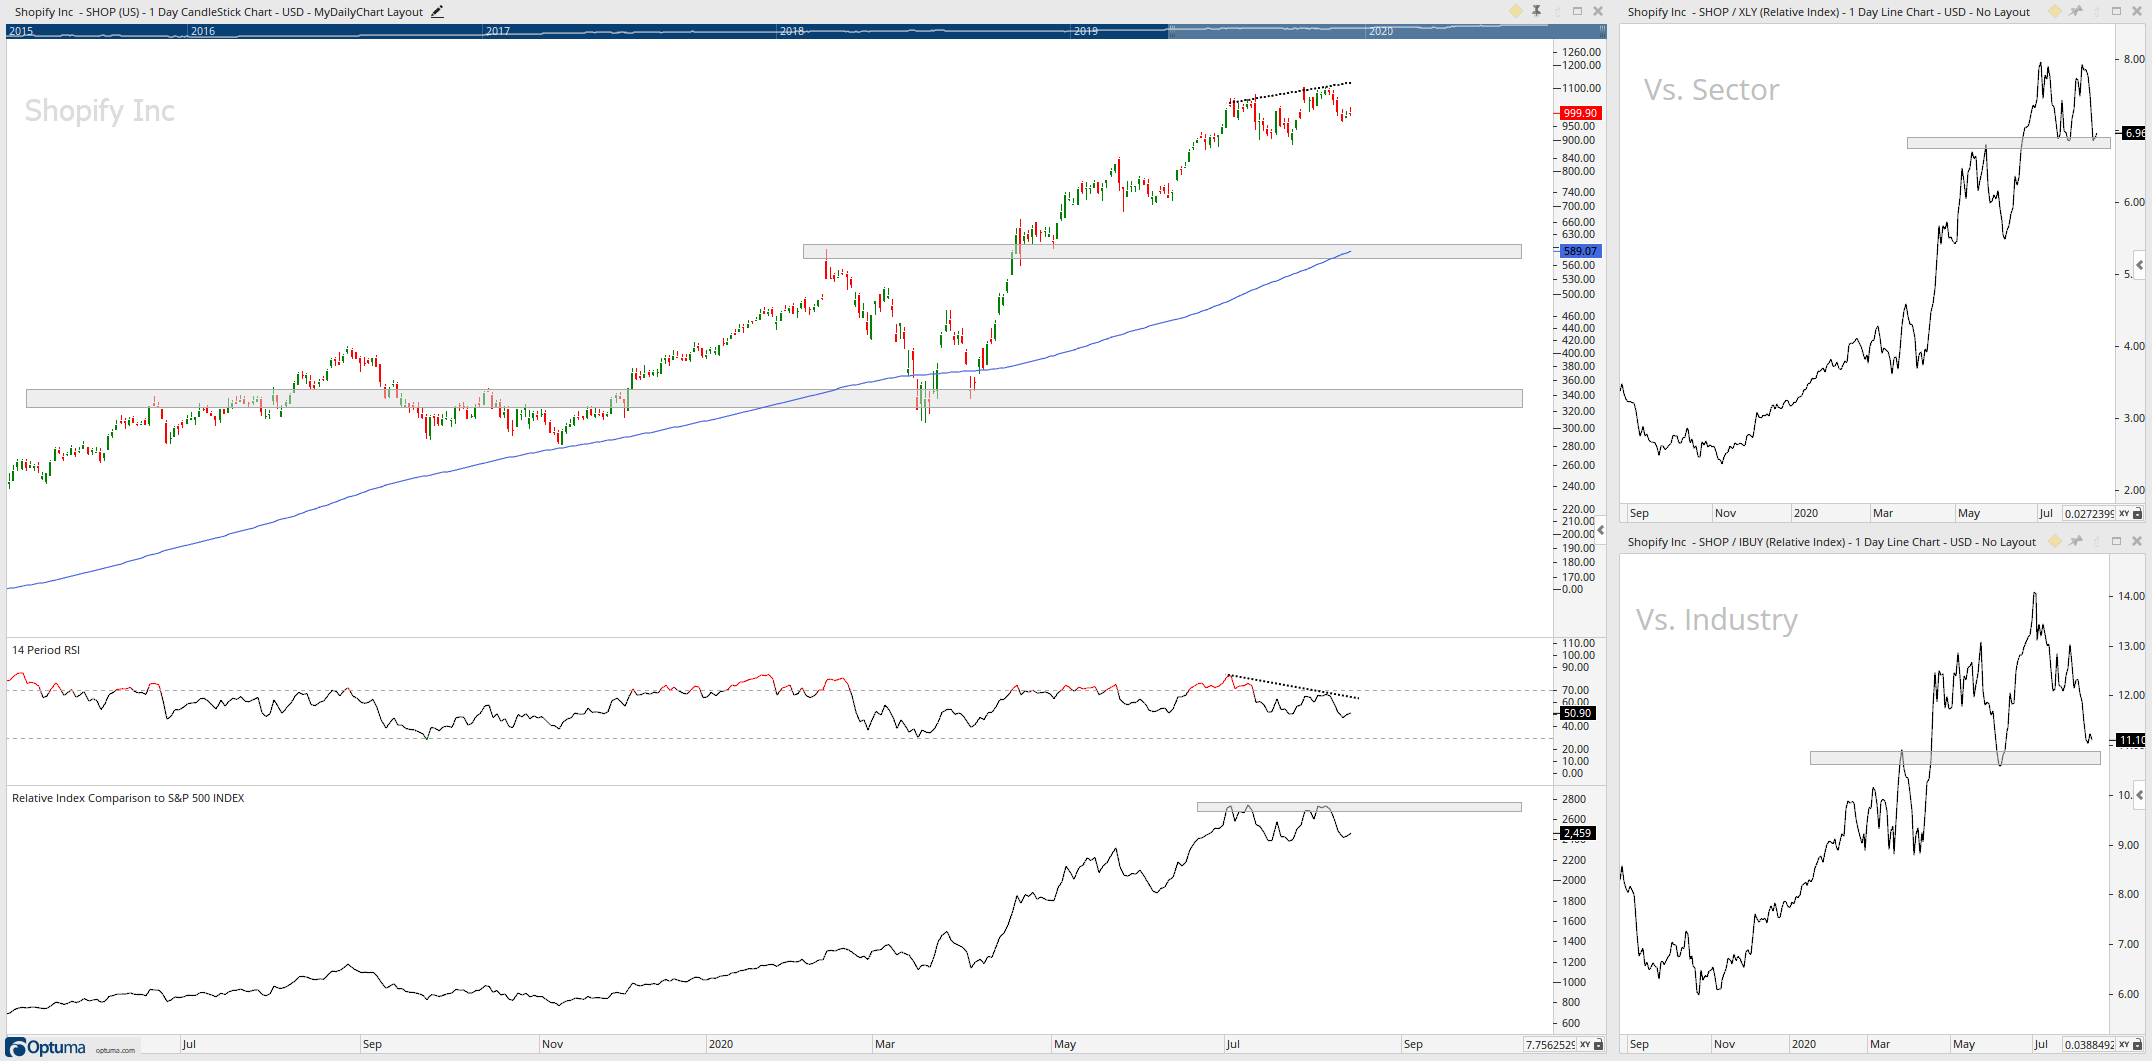
After a strong recovery from its March lows is Shopify now showing signs of weakness with a divergence coming in play? Relative to XLY and IBUY are both at key levels of support. The key level I am watching to hold as support is around the $600 region.
Overstock

Overstock was in a downtrend, but it looks as this lockdown saved overstock for further downside. Overstock continues to breakout of levels with a vertical move to the upside, are we currently seeing a retest of 2018 highs and a resumption higher? The key level I am watching to hold as support is around the $90 region.
Peloton
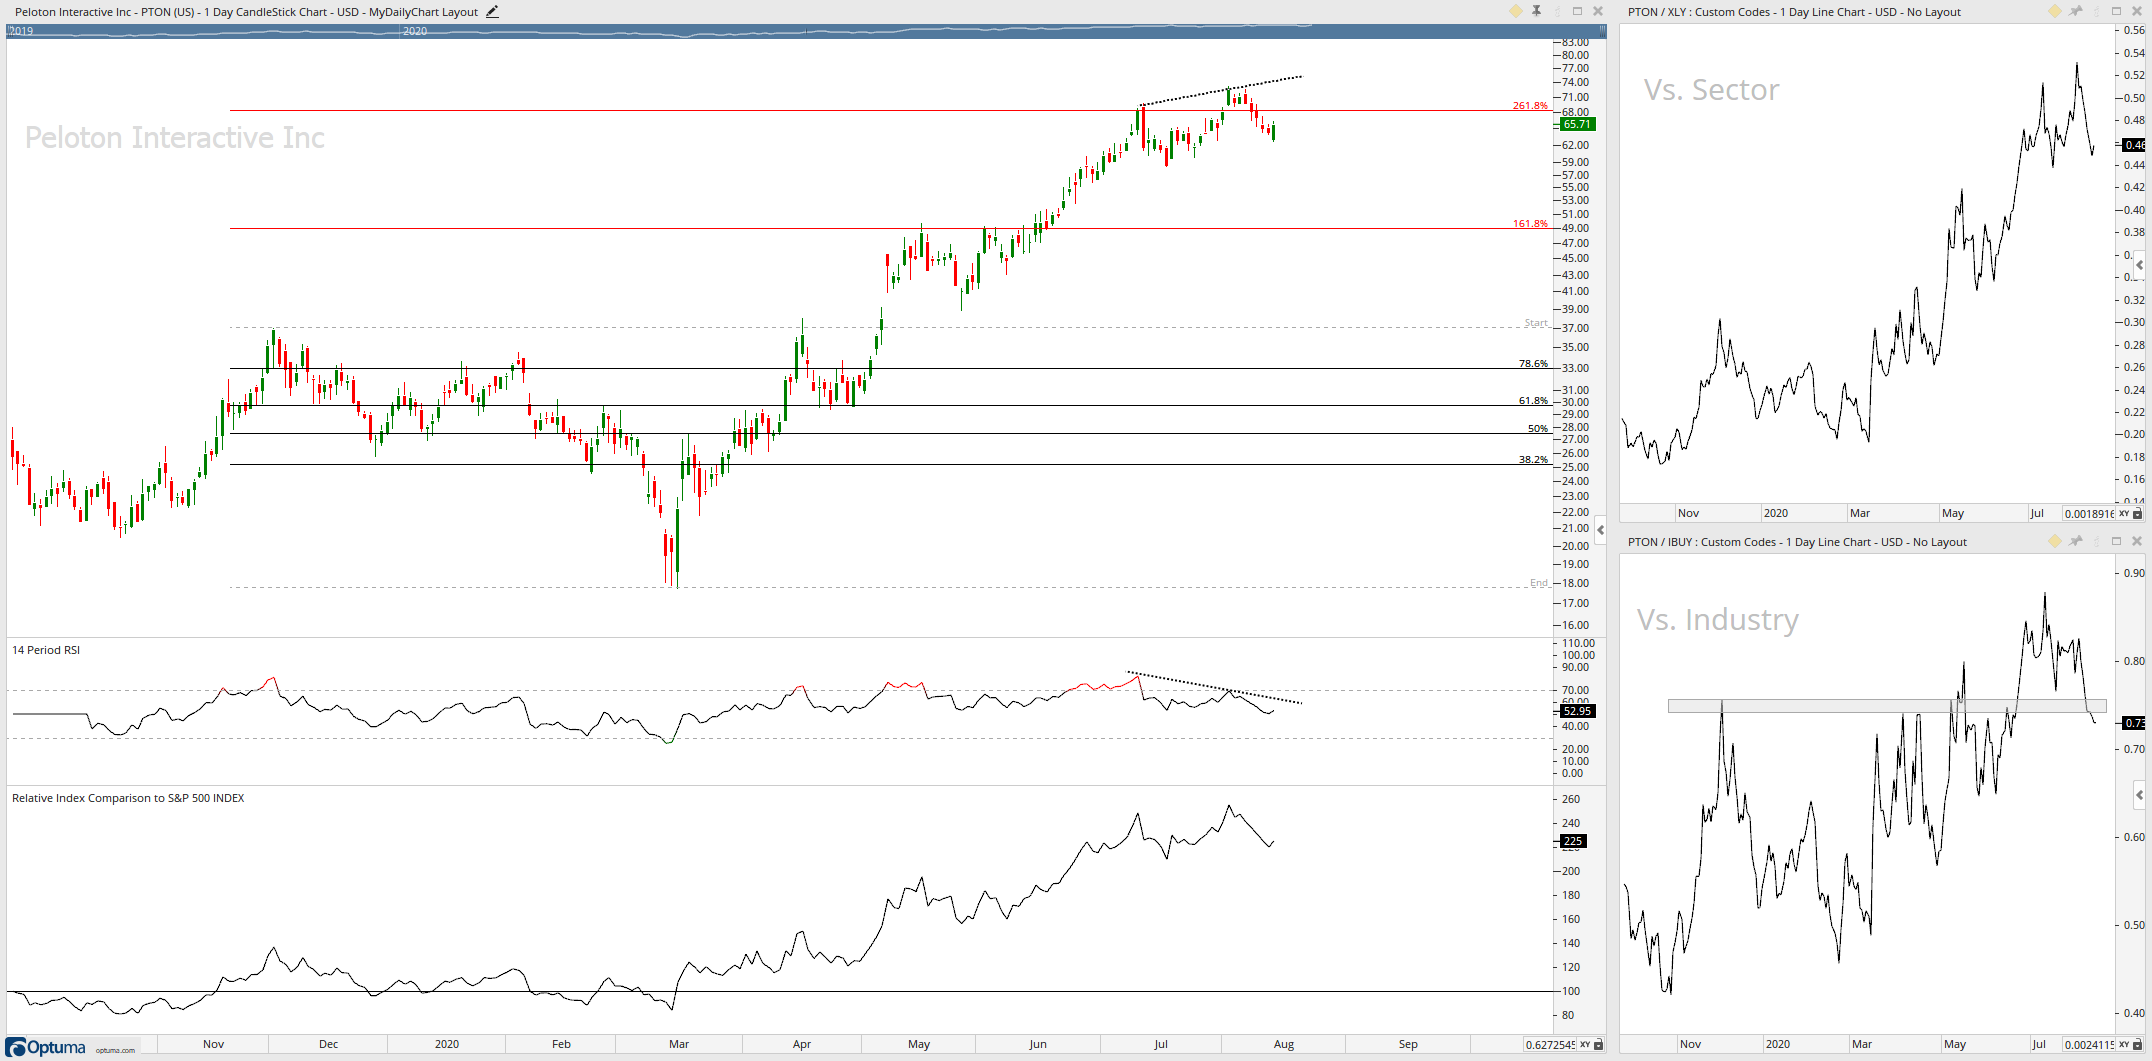
Similar to Shopify, Peloton ripped from its March lows; however, it is finding some resistance at its 261.8% Fibonacci extension level and also showing signs of weakness with a divergence in play. The key level I am watching to hold as support is around the $49 region.
Until next week!
Stay safe and good luck out there…
GH
DISCLAIMER: The information included in this report are obtained from sources which Jotting on Charts believes to be reliable, but we do not guarantee its accuracy. All of the information contained herein should be independently verified and confirmed. All opinions expressed by Jotting on Charts are for informational purposes only. Jotting on Charts is not a financial advisor, and this does not constitute investment advice nor any opinions expressed, constitute a solicitation of the purchase or sale of any securities or related financial instruments. Jotting on Charts is not responsible for any losses incurred from any use of this information. Do not trade with money you cannot afford to lose. It is recommended that you consult a qualified financial advisor before making any investment decisions.