This is going to be my final blog post of the year!
Have a great holiday season, my lovely followers! Best wishes for 2021!
Every Monday, I want to share my favourite high-level charts from my weekend charting session.
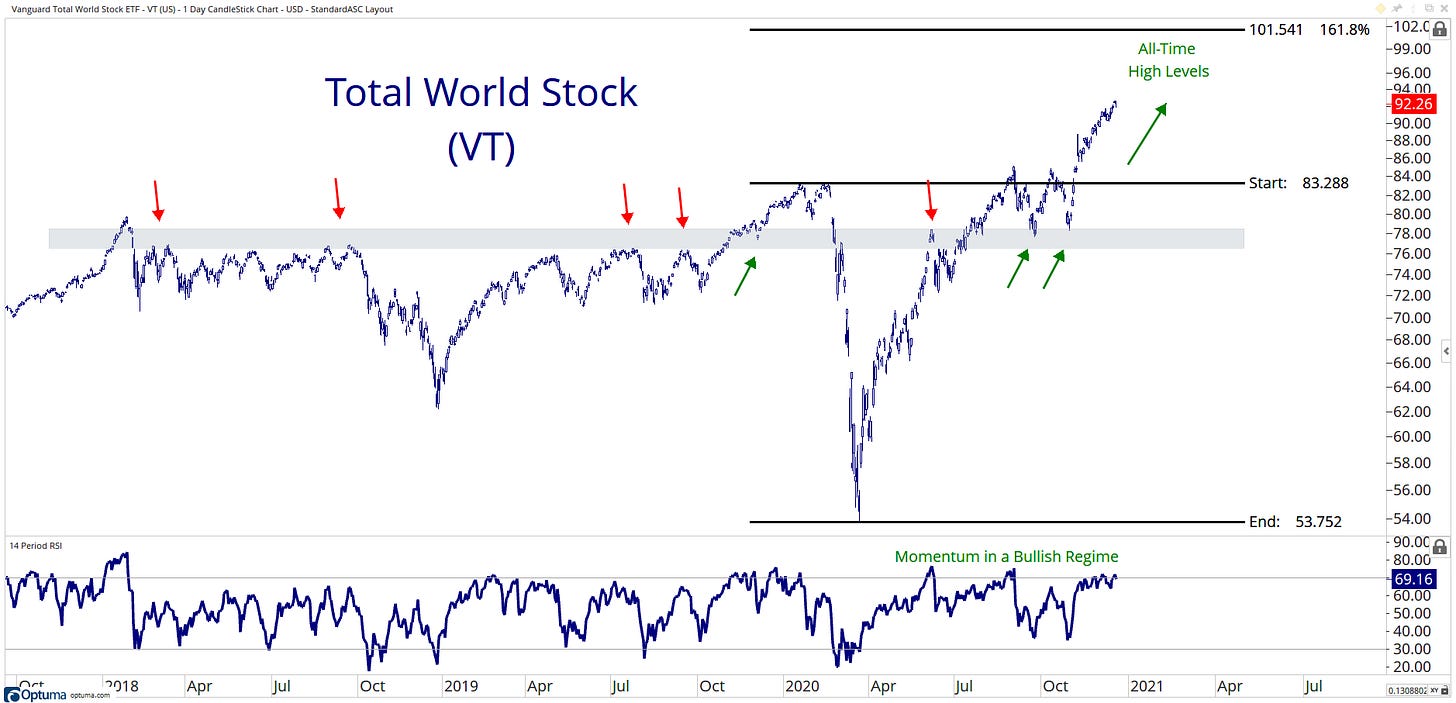
World
Stocks around the globe continue to work… KISS baby!
US
The Nasdaq100 has been consistently outperforming its peer indexes for over a decade now, and the trend continues to accelerate.
Nasdaq100 decided to correct over time rather than a pullback as you can clearly see it was range bound from September till November. This current breakout above 300 needs to hold if this market is to have further ammunition in the near-term.
US Sectors
Cyclical stocks represent companies that make or sell items and services that are in demand when the economy is doing well. Many of the most important risk-on sectors (Industrials $XLI, Materials $XLB, and Financials $XLF) are slowly grinding upwards away from important price levels.
US Industries
Real Estate relative to the S&P 500 is the golden child of downtrends! Closing last week out at a new all-time relative low.
Fixed Income
Why are you invested in bonds in this current market? Any other asset class is better right about now.
Commodities
Copper is leading the way in the commodity space.
As long as this ratio continues to grinds higher, it would be significant support for the currently working risk-on/reflation trade.
Currencies
This one hurts me a little right now, I should be sharing a drink with my family and friends in Australia around this time of the year, but I can’t get out of Russia! Thanks covid….
Anyways back to the chart…
The Aussie Dollar/US Dollar continues to move forward, breaking all levels of resistance and looks like we might see a move to retest those 2017/2018 highs at 0.82
Intermarket
Leaders lead, right? Well, they are currently on the ropes here! Can they hold above this major level which was once resistance now turned support?
Factor
Growth continues to work! It looks like nothing is going to stop this monster!
Breadth
The current market cap rotation we are seeing into Small- and Mid-Caps can be clearly seen in this breadth chart of S&P 600 Small-Caps with it posting its highest reading of new 52-week highs since early 2018.
Themes
Ready for a holiday? Looks like a breakout, retest and go setup?
Data Snapshot: As of 18th December 2020
My data snapshot is a current and brief overview of the leaders and laggards throughout the equity market.
Performance Overview:
RTM:
Regime: Bullish Regime indicates the 14-day Relative Strength Index reading is between 100-31 and remains until the value is less than 30 and a Bearish Regime indicates the 14-day Relative Strength Index reading is between 0-69 and remains until the value is more than 70
Trend: A positive percentage (coloured green) indicates how far the 50-day moving average is above the 200-day moving average and a negative percentage (coloured red) indicates how far the 50-day moving average is below the 200-day moving average.
Momentum: A positive percentage (coloured green) indicates that the 63-day rate of change is positive, and a negative percentage (coloured red) indicates that the 63-day rate of change is negative.
Bonus Chart!!
Here is a bonus chart that shows the current key themes, broadening participation and market cap rotation, Strength from commodities and emerging markets which rolls over to strength from ‘risk-on’ currencies.
That’s a wrap for today, hope you enjoyed my charts, and please don’t forget to share your ideas in the comment section or get in contact with me on Twitter @granthawkridge.
Stay safe and good luck out there…
GH
DISCLAIMER: The information included in this report are obtained from sources which Jotting on Charts believes to be reliable, but we do not guarantee its accuracy. All of the information contained herein should be independently verified and confirmed. All opinions expressed by Jotting on Charts are for informational purposes only. Jotting on Charts is not a financial advisor, and this does not constitute investment advice nor any opinions expressed, constitute a solicitation of the purchase or sale of any securities or related financial instruments. Jotting on Charts is not responsible for any losses incurred from any use of this information. Do not trade with money you cannot afford to lose. It is recommended that you consult a qualified financial advisor before making any investment decisions.


