I’M BACK!!
Well well well… Welcome back… Happy new year to all my lovely followers! Best wishes for 2021! hopefully you all had some time off the screens and away from the charts… guess what… they weren’t going anywhere!
I went to my dacha for a few days which backs onto a forest.. no other words than magical!
Oh yeah, most of you are not from Russia… so a ‘dacha’ is the Russia word for a holiday house.
Okay, the break is over! let us look at some of my key themes going into 2021.
US equities over World equities.
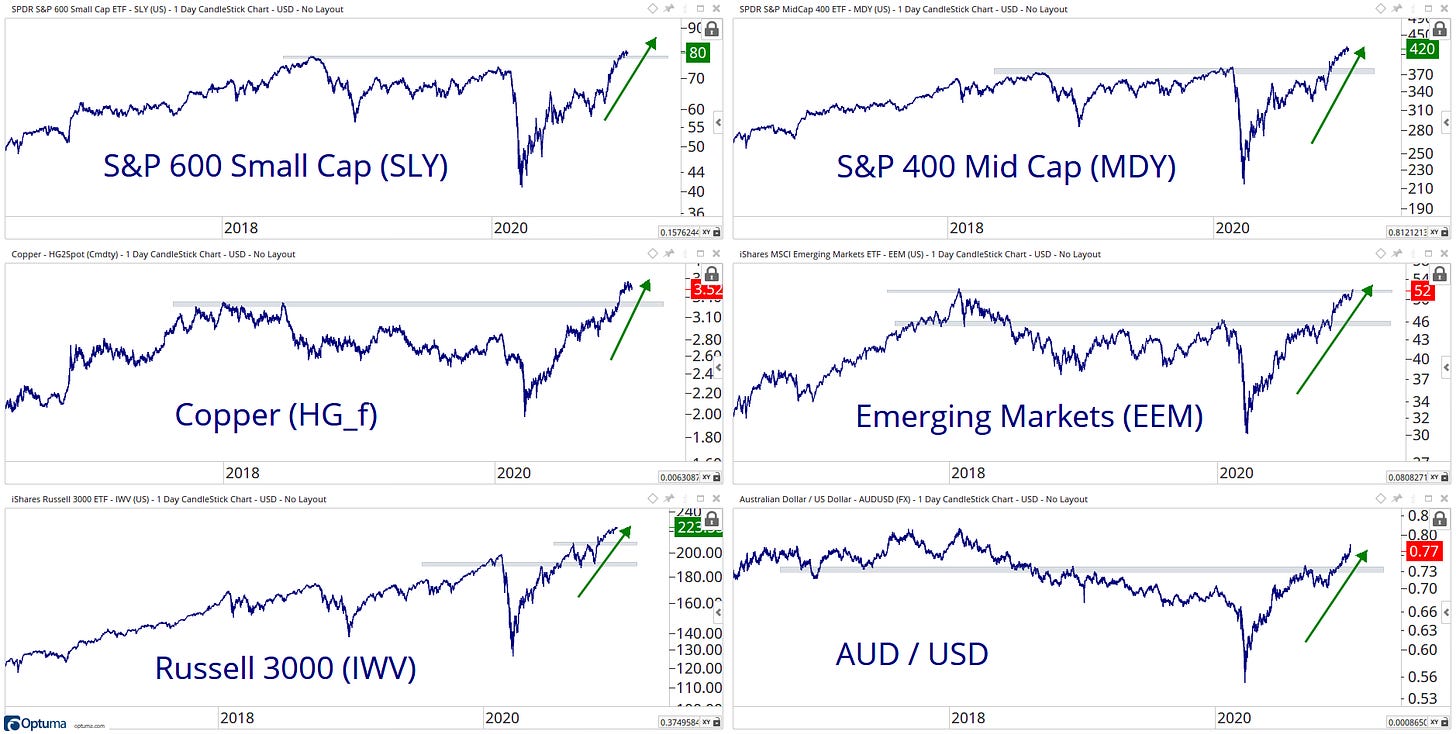
Broadening participation.
Small & Mid over Big, at least for the Q1.
Cyclicals over Defensives.
Growth over Value will still be a thing.
Strength from commodities and emerging markets
‘Risk-on’ currencies to outperform, Dollar weakness.
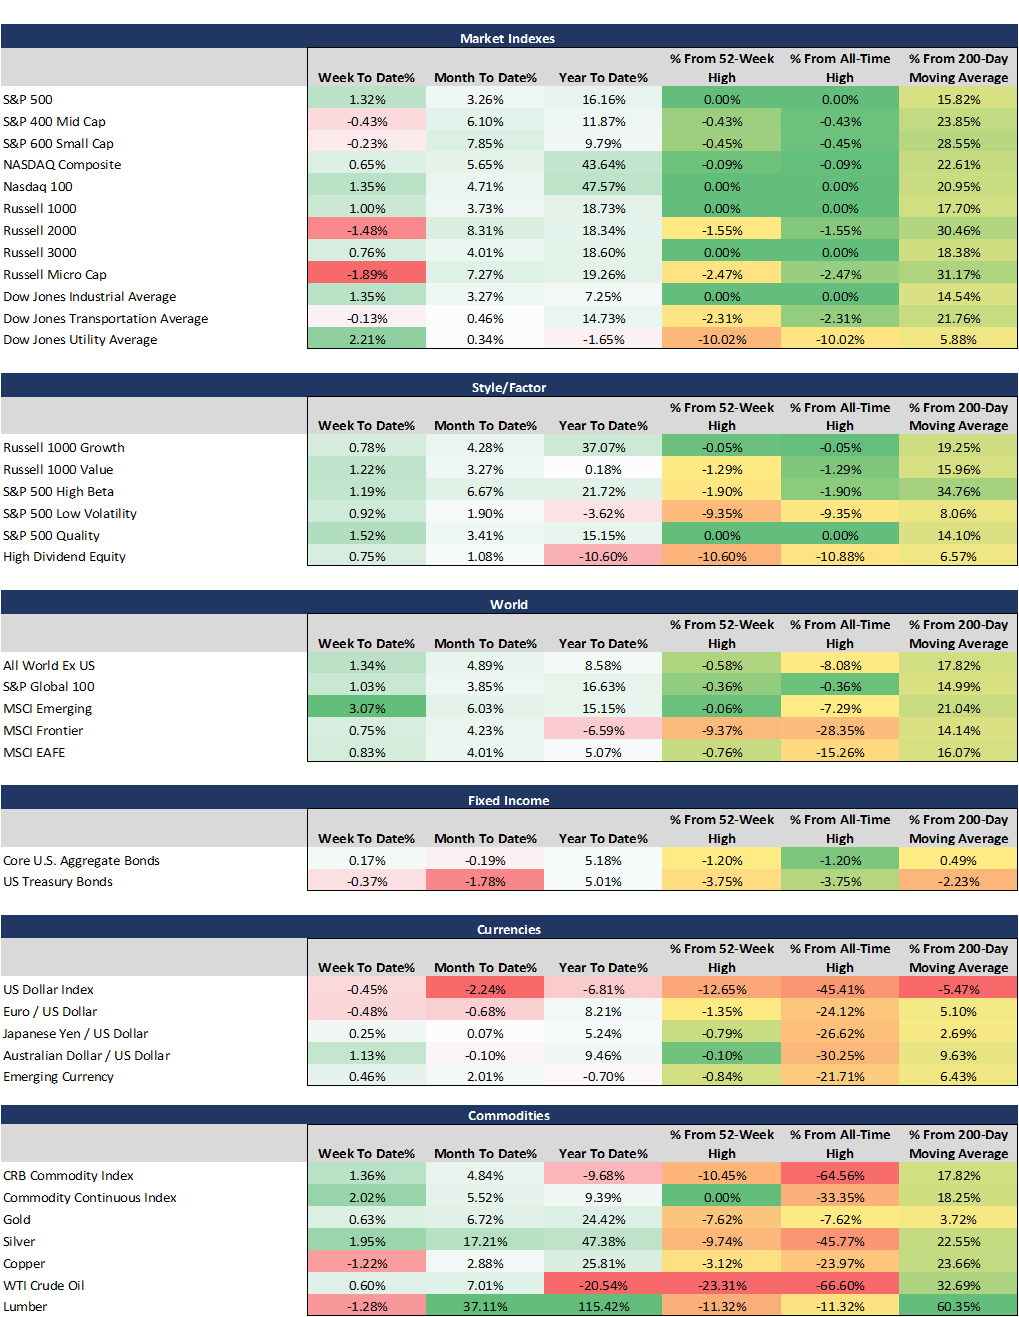
Here is a Performance overview… the last one for 2020!
YTD Hot: Large-Cap, Growth & Lumber.
YTD Not So Hot: Oil, Value & US Dollar.
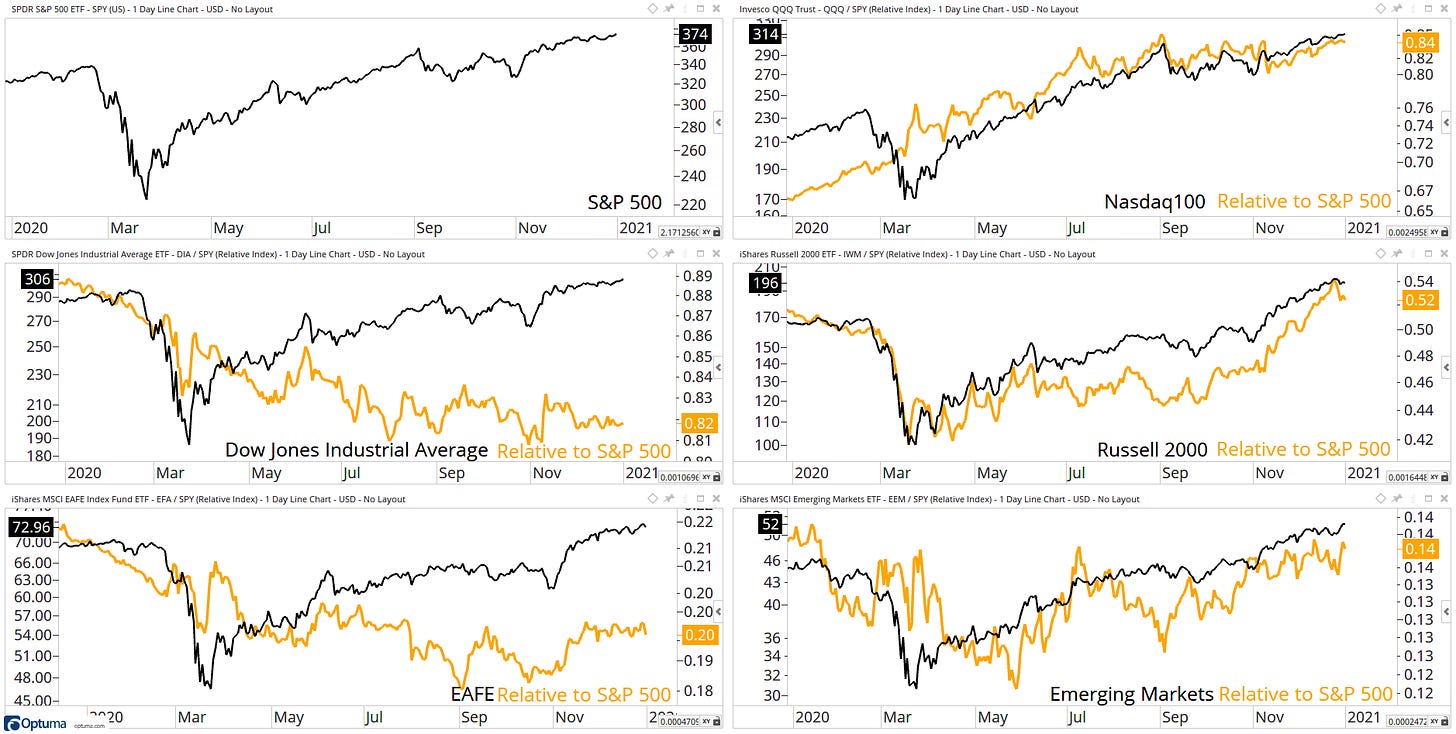
Broad participation is the key theme in the below chart, S&P 500, Russell 2000, NASDAQ100, Dow Jones Industrials, EAFE, Emerging Markets at all-time highs or 52-week highs.
On a relative basis, leadership in the NASDAQ-100 & Russell 2000 has been extraordinary since March lows. Emerging Markets are also attempting to break through its relative resistance level.
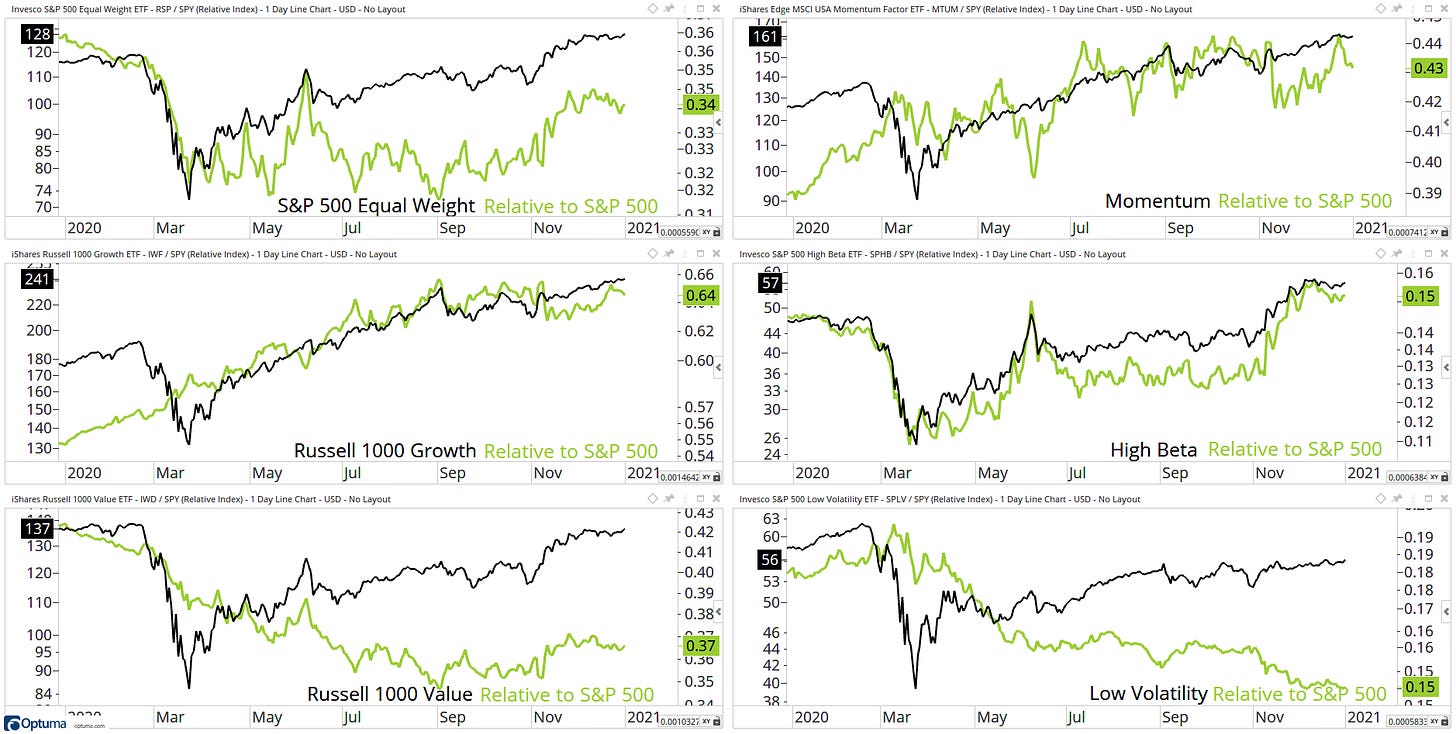
Last year's prevailing market theme was Growth outperforming Value and High-Beta outperforming Low-Volatility, Will this follow into 2021?
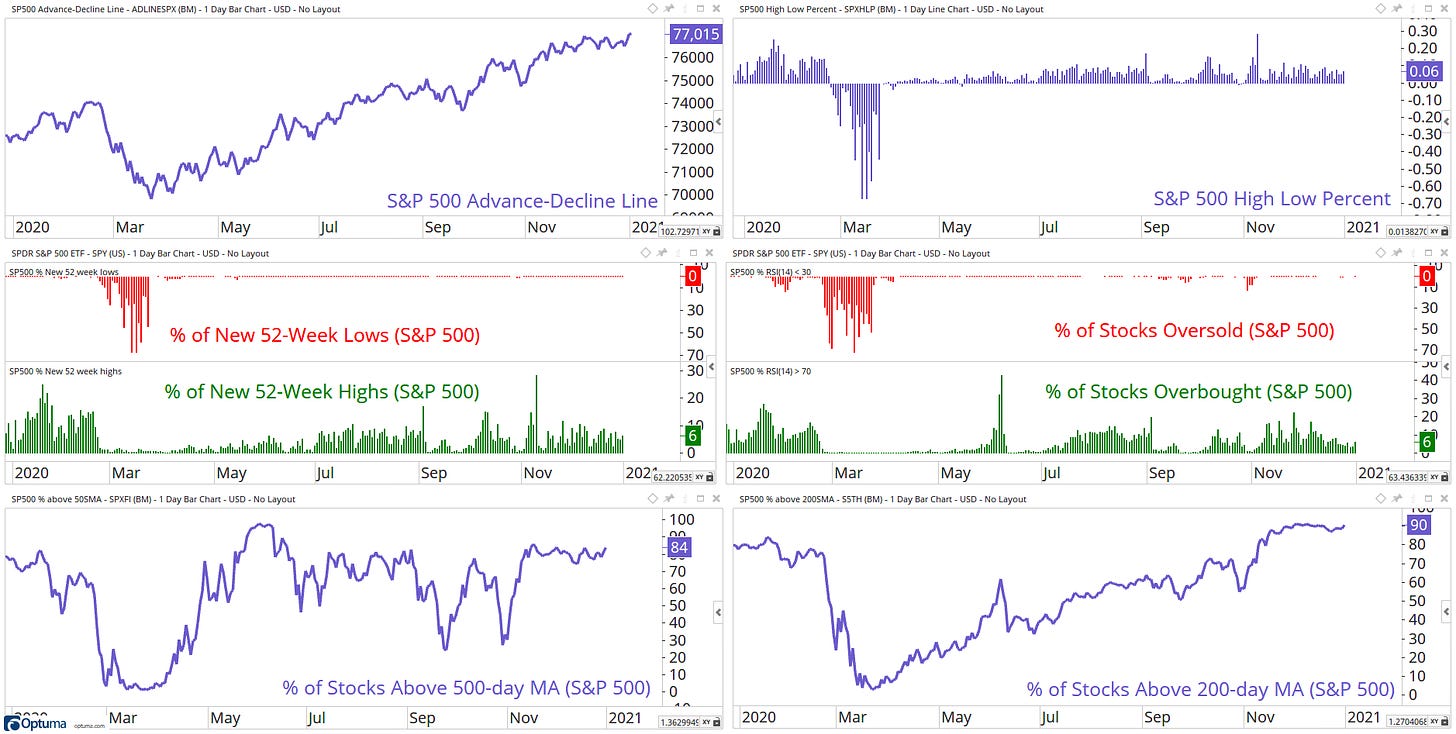
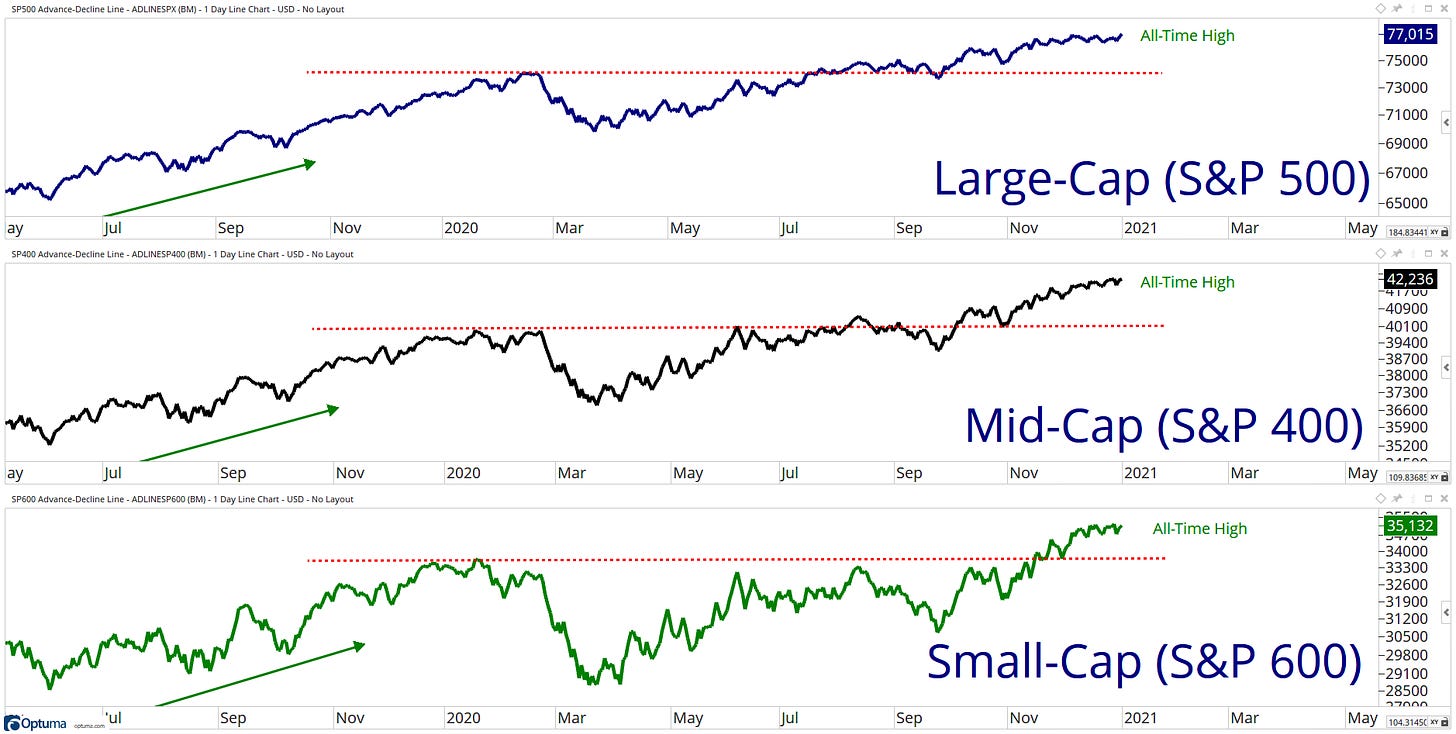
Breadth is positive…
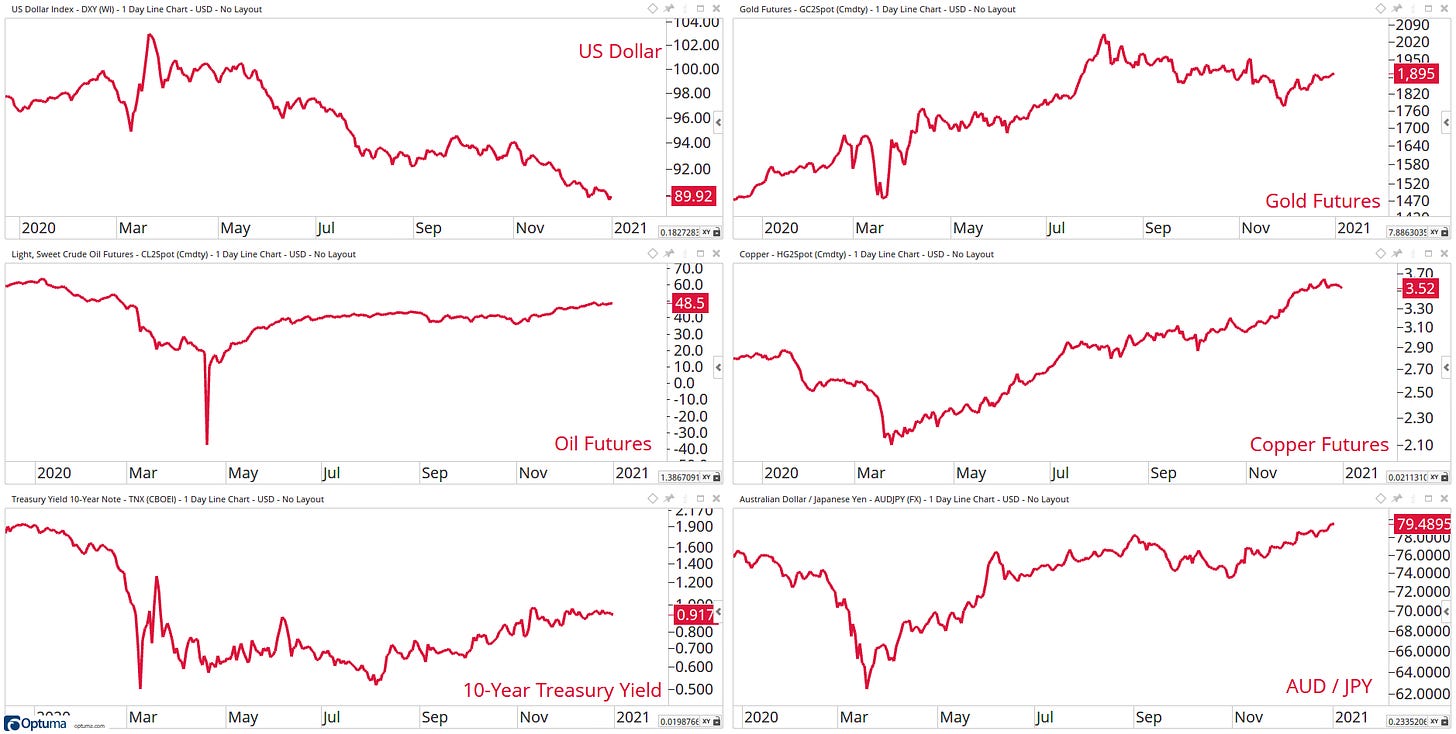
Higher inflation expectations suggest rates grind higher, continue strength from copper and a lower US dollar with outperformance within ‘risk-on’ currencies.
The Snapshot
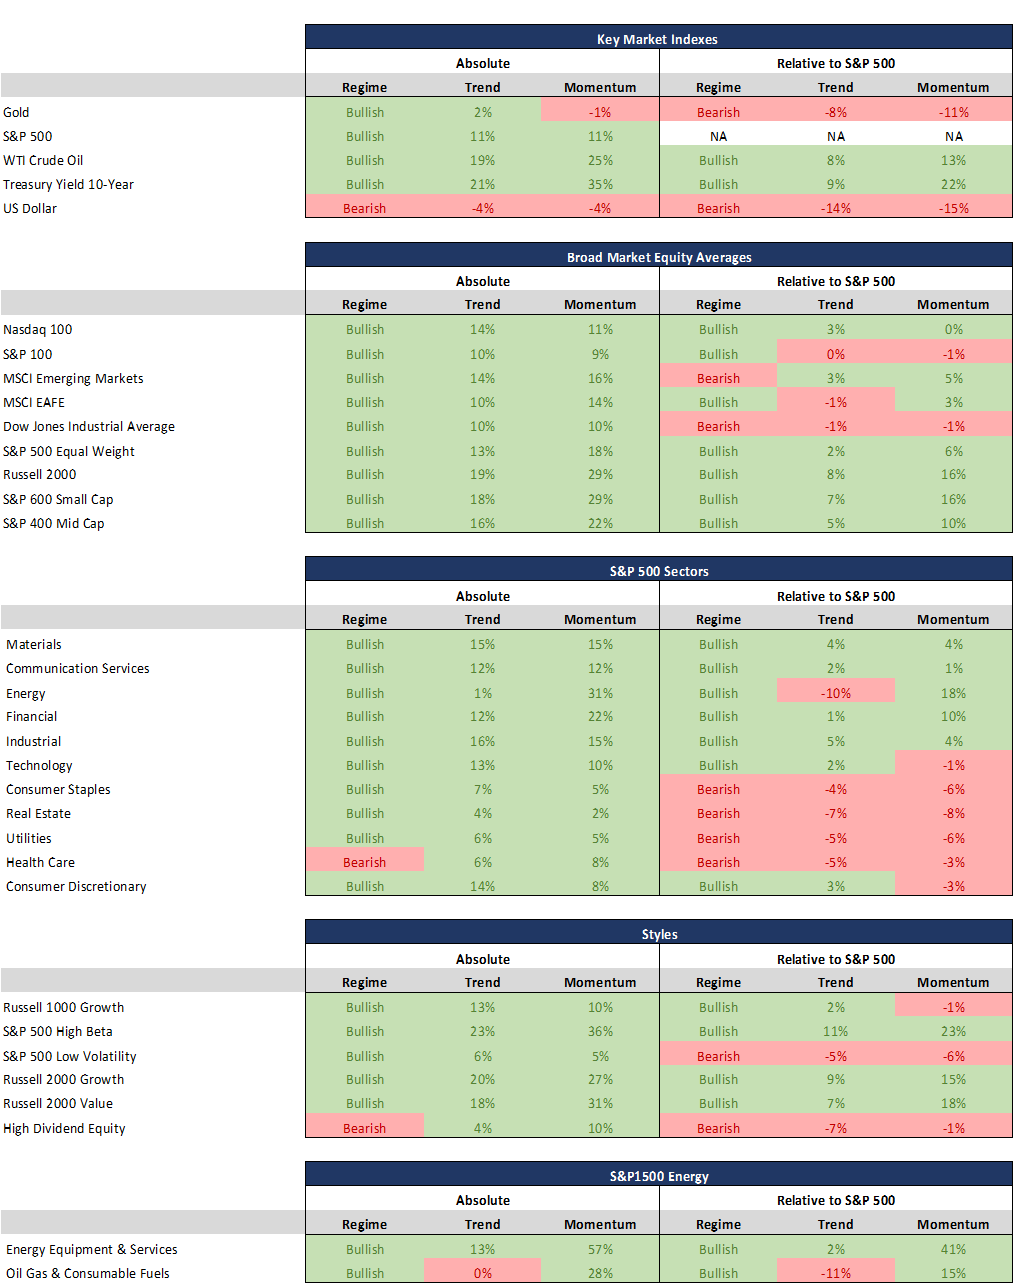
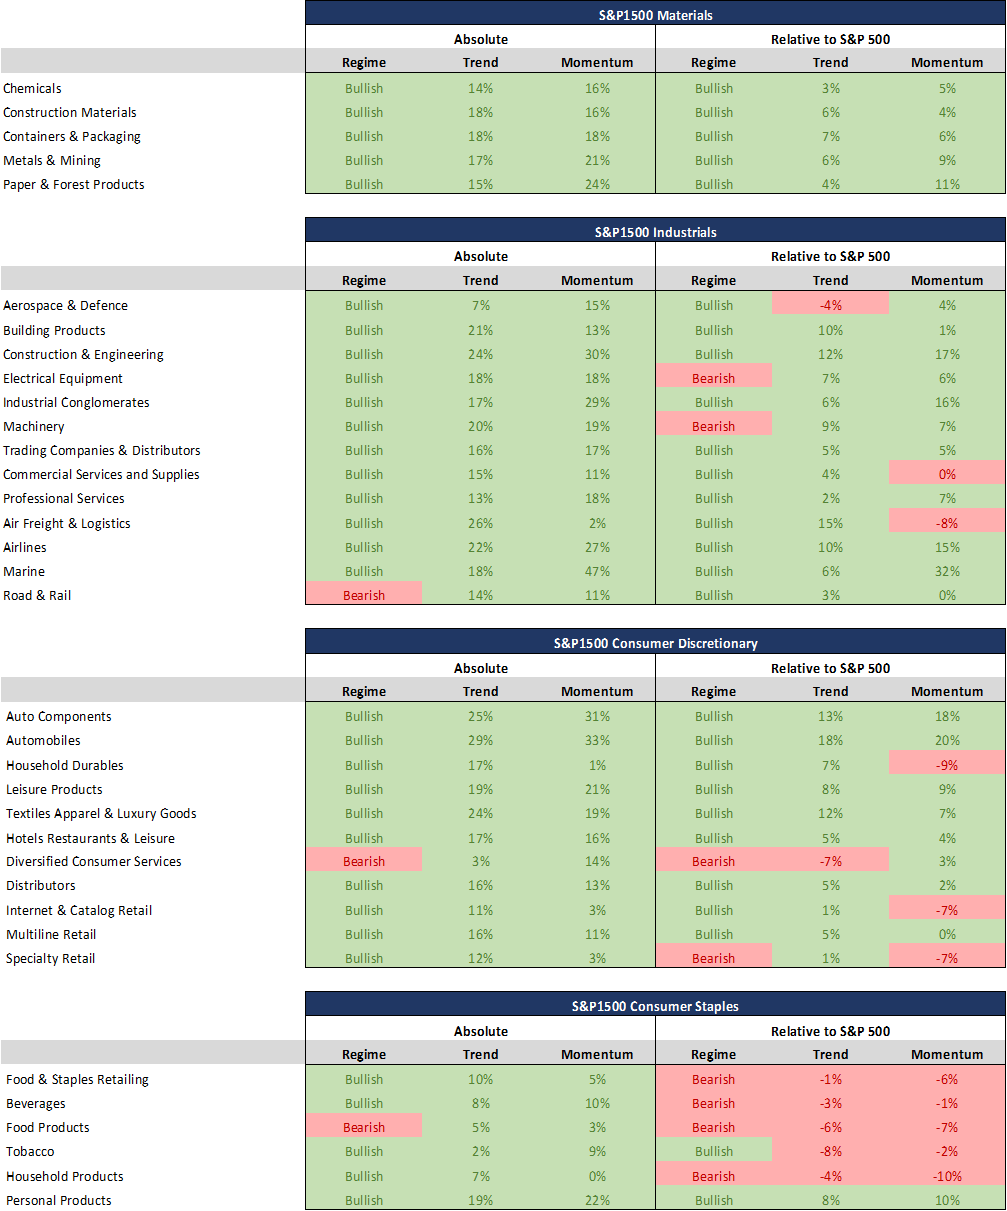
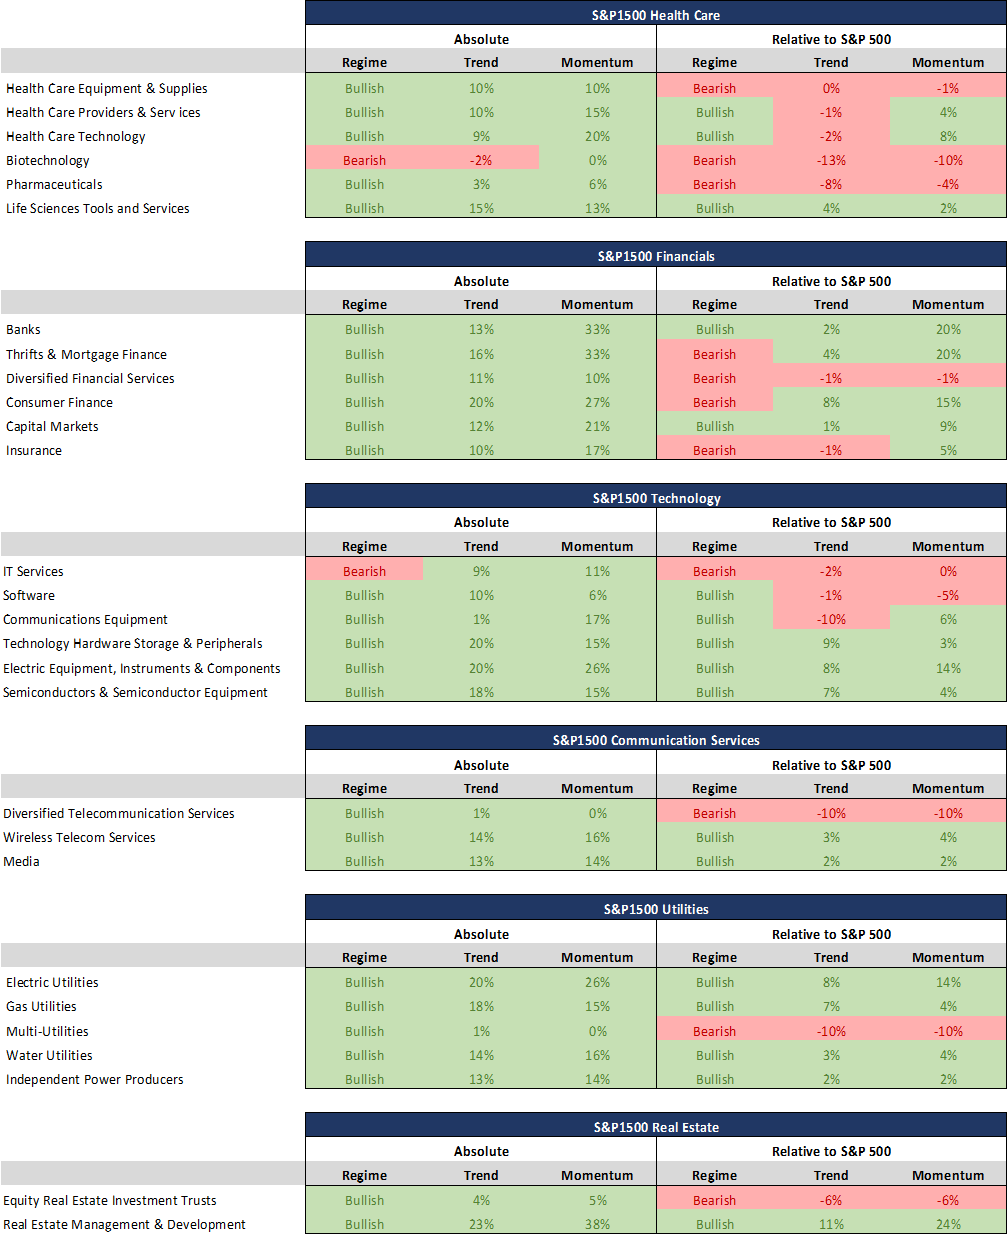
My data snapshot is a current and brief overview of the leaders and laggards throughout the equity market.
RTM:
Regime: Bullish Regime indicates the 14-day Relative Strength Index reading is between 100-31 and remains until the value is less than 30 and a Bearish Regime indicates the 14-day Relative Strength Index reading is between 0-69 and remains until the value is more than 70
Trend: A positive percentage (coloured green) indicates how far the 50-day moving average is above the 200-day moving average and a negative percentage (coloured red) indicates how far the 50-day moving average is below the 200-day moving average.
Momentum: A positive percentage (coloured green) indicates that the 63-day rate of change is positive, and a negative percentage (coloured red) indicates that the 63-day rate of change is negative.
Now I am going to share my favourite charts from my weekend charting session.
World
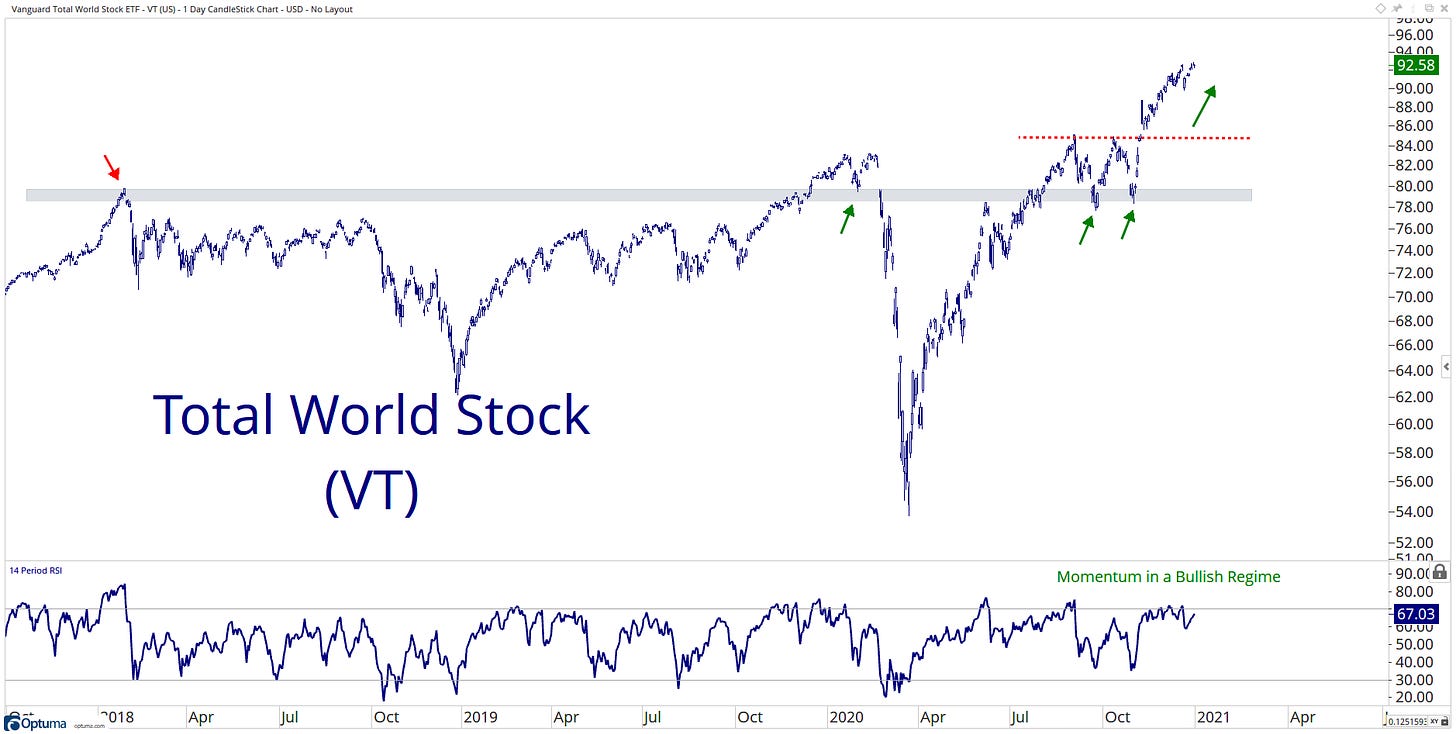
$VT seeks to track the performance of stocks of companies located in developed and emerging markets around the world, with 54% of the ETF invested in the US markets.
$VT did nothing from 2018 until it recently in late 2020 it broke out to the upside with a solid move and it closed the year at all-time high levels which is a positive for the bullish thesis.
US
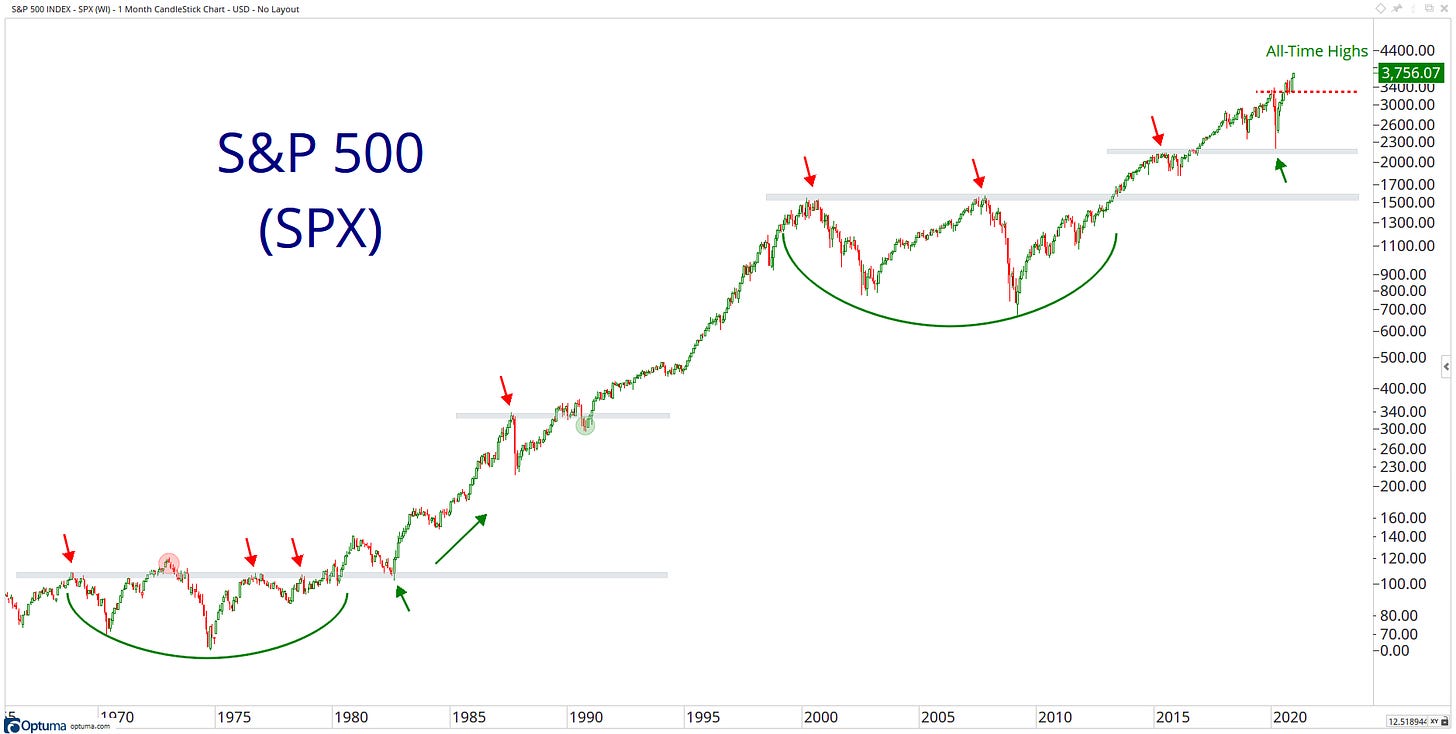
My only thought is, all-time monthly closing high! This is bullish!… don’t be scared of markets at all-time highs!
US Sectors
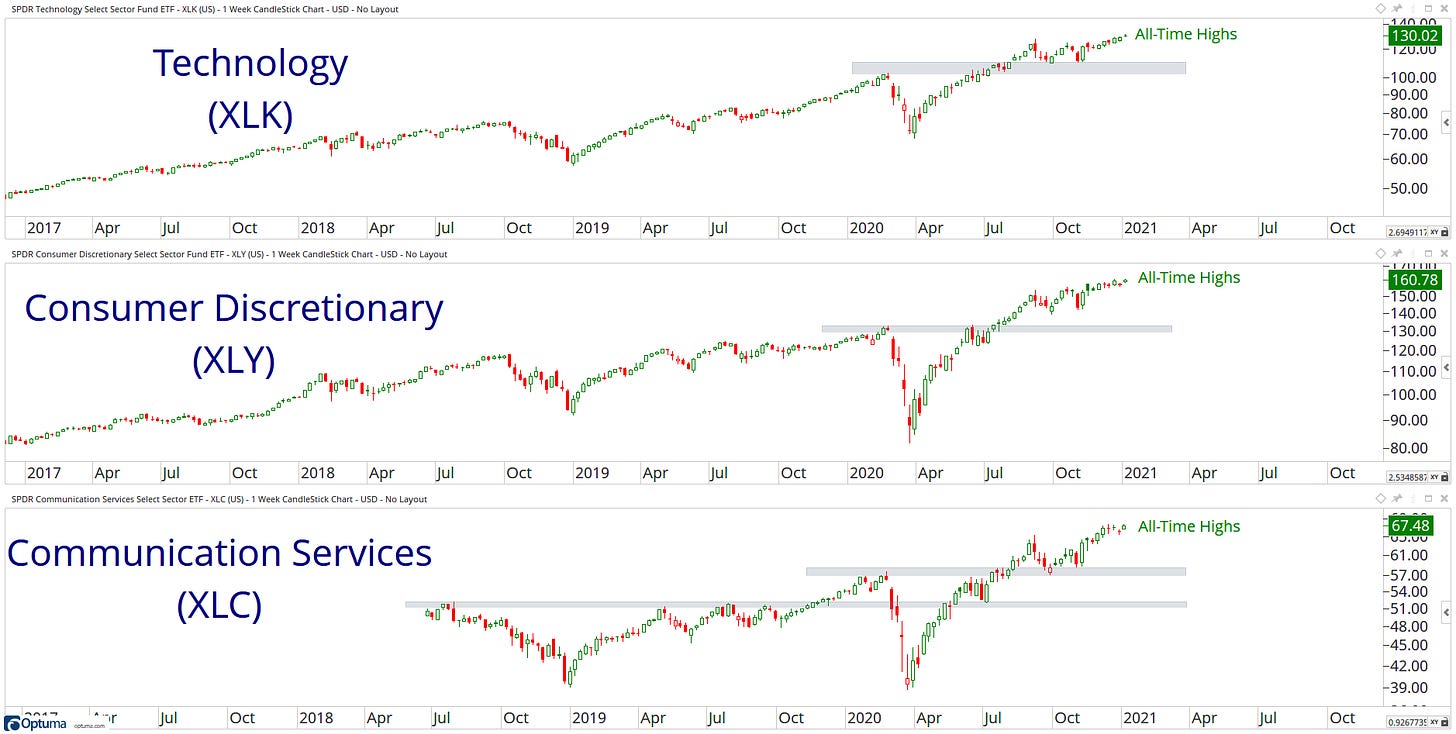
Large-cap growth/tech is still working, and I think we will continue to see this in 2021.
US Industries
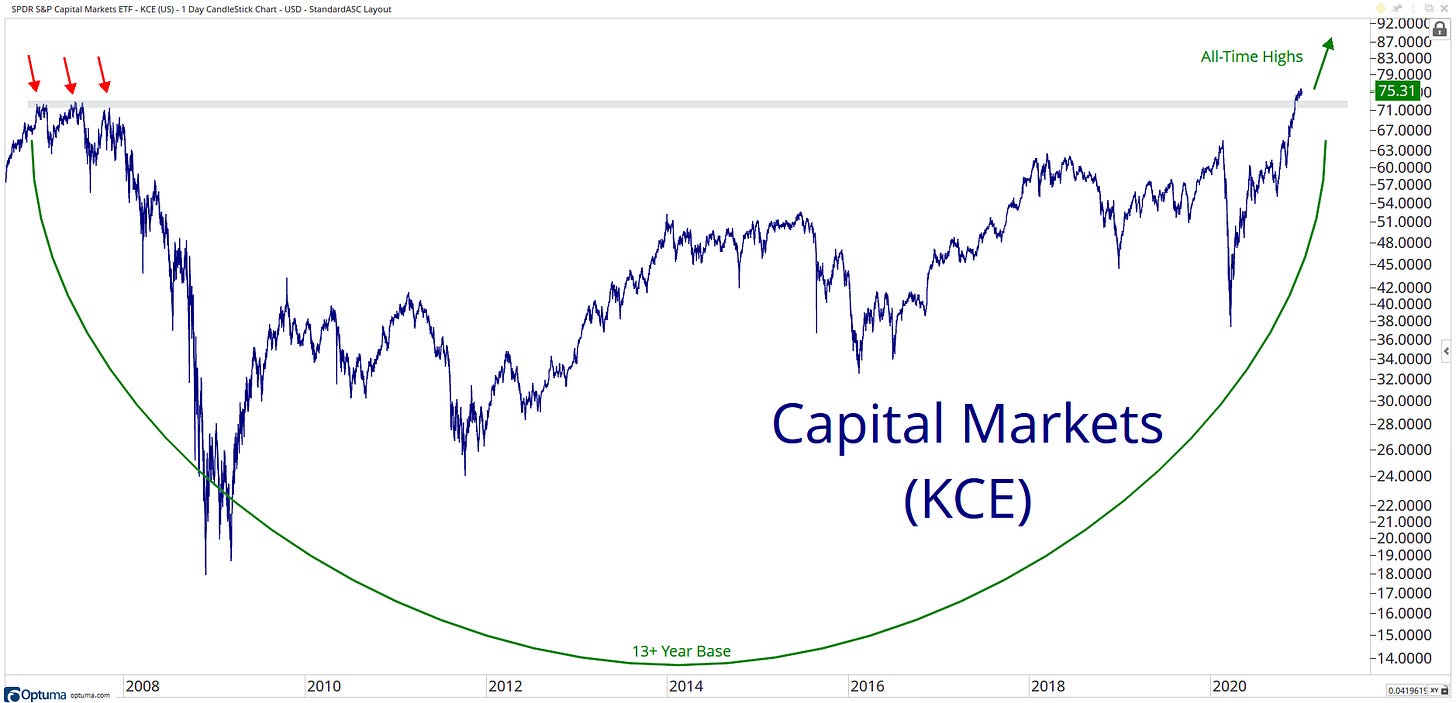
New all-time highs from any area of Financials is a welcomed addition. The question that remains is whether this strength in Capital Markets an evidence for the remainder of the sector?
Capital Markets ETF is currently breaking out of a 13+ year base to its highest level EVER!! Just think about that for a second! This is definitely not bearish development!
Fixed Income
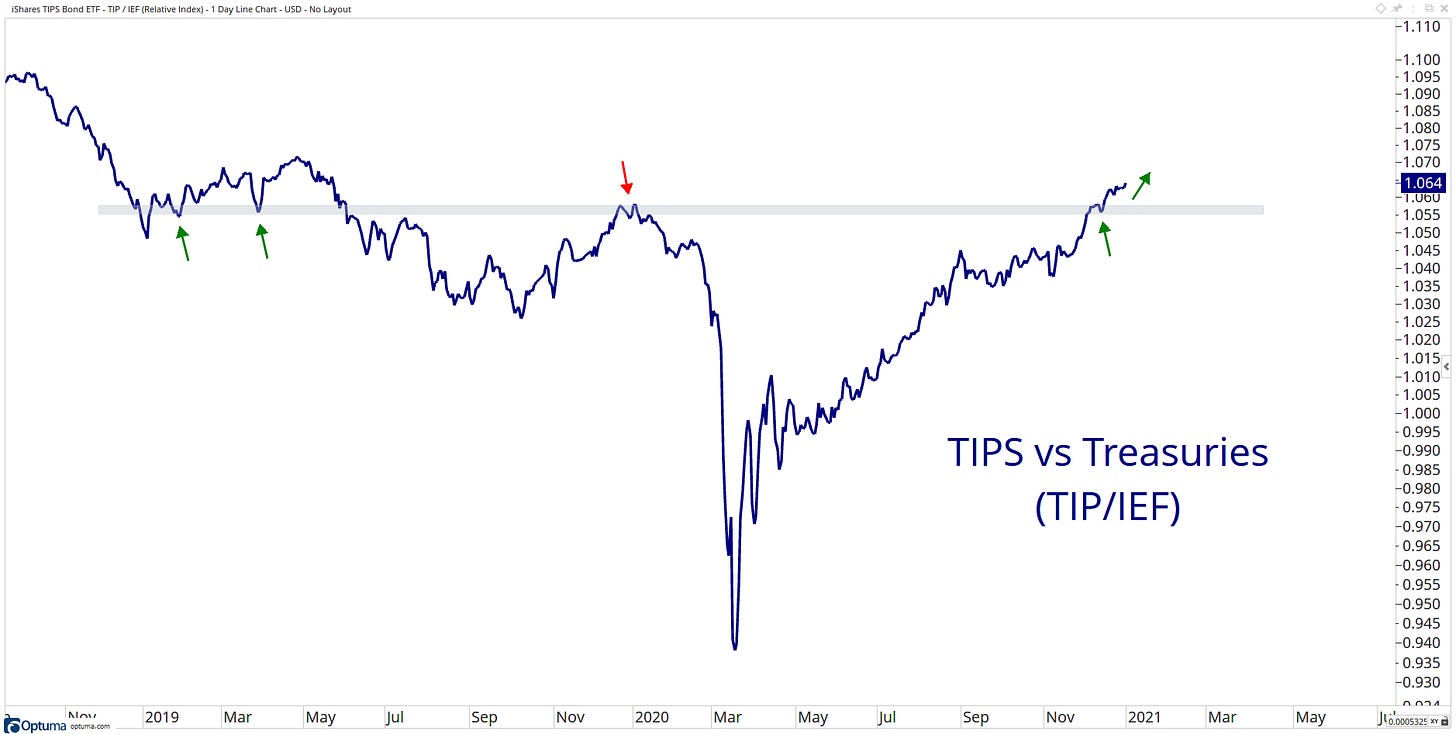
Inflation expectations continue to rise. After collapsing in March, the ratio of TIPS to treasuries has trended steadily higher and breaking above a key inflection area.
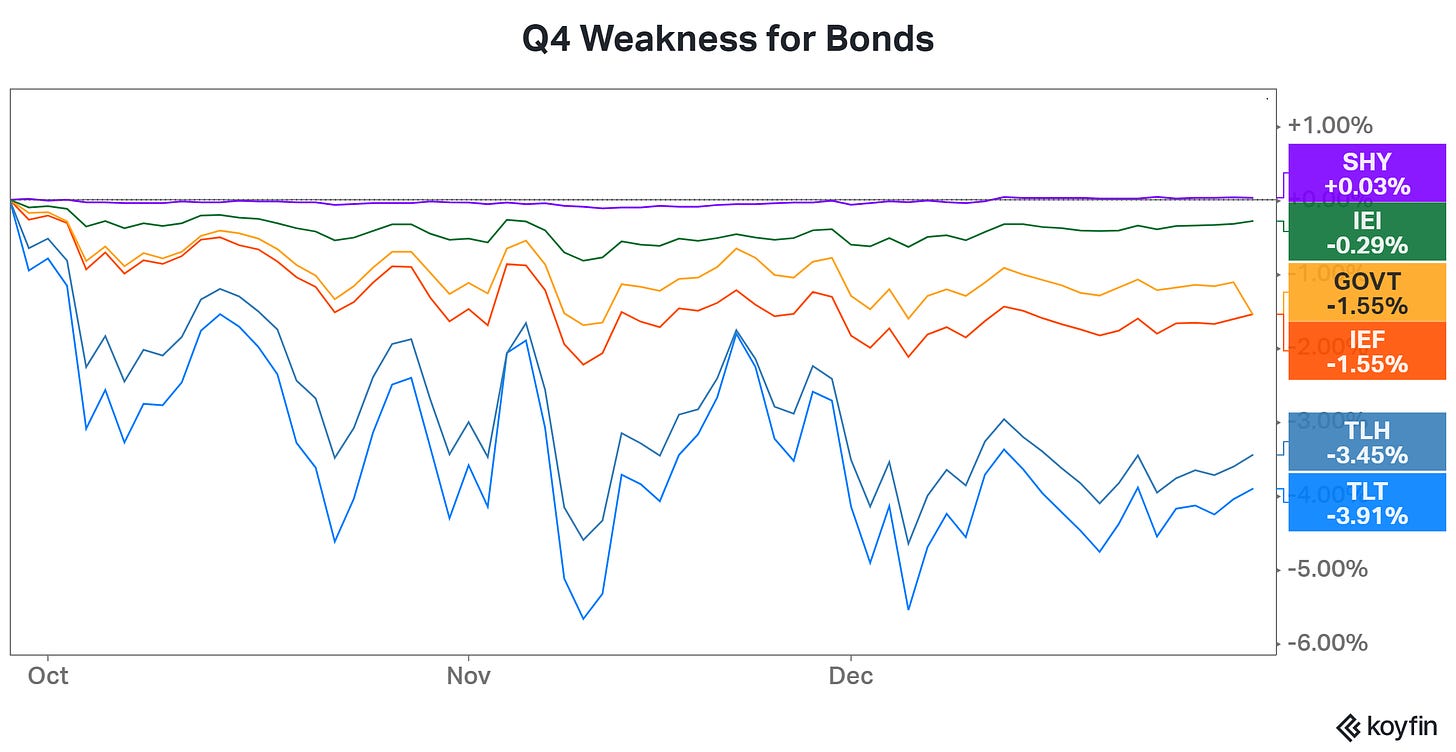
Treasuries had a poor Q4…
Commodities
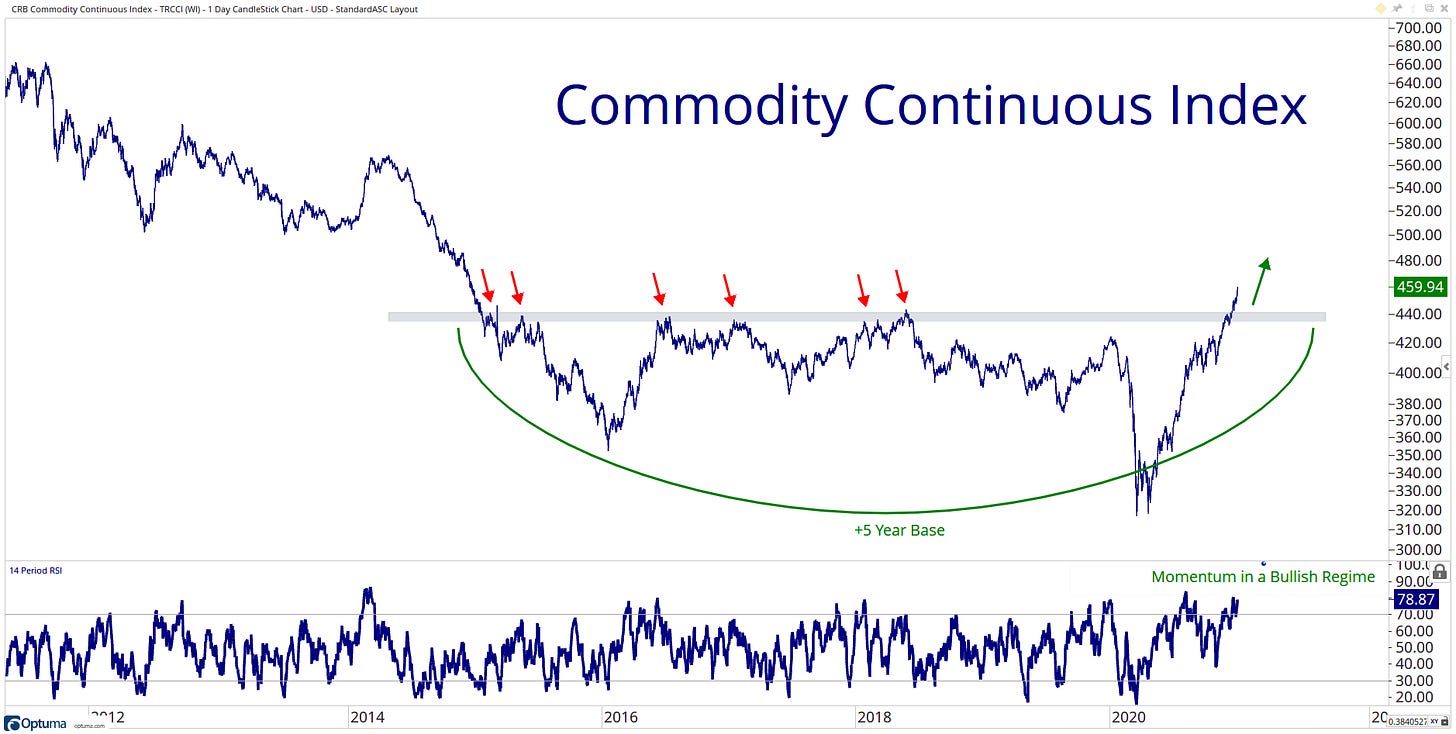
Commodity Continuous index breaking out of a 5-year base fits in nicely with the higher inflation expectations thesis.
Currencies
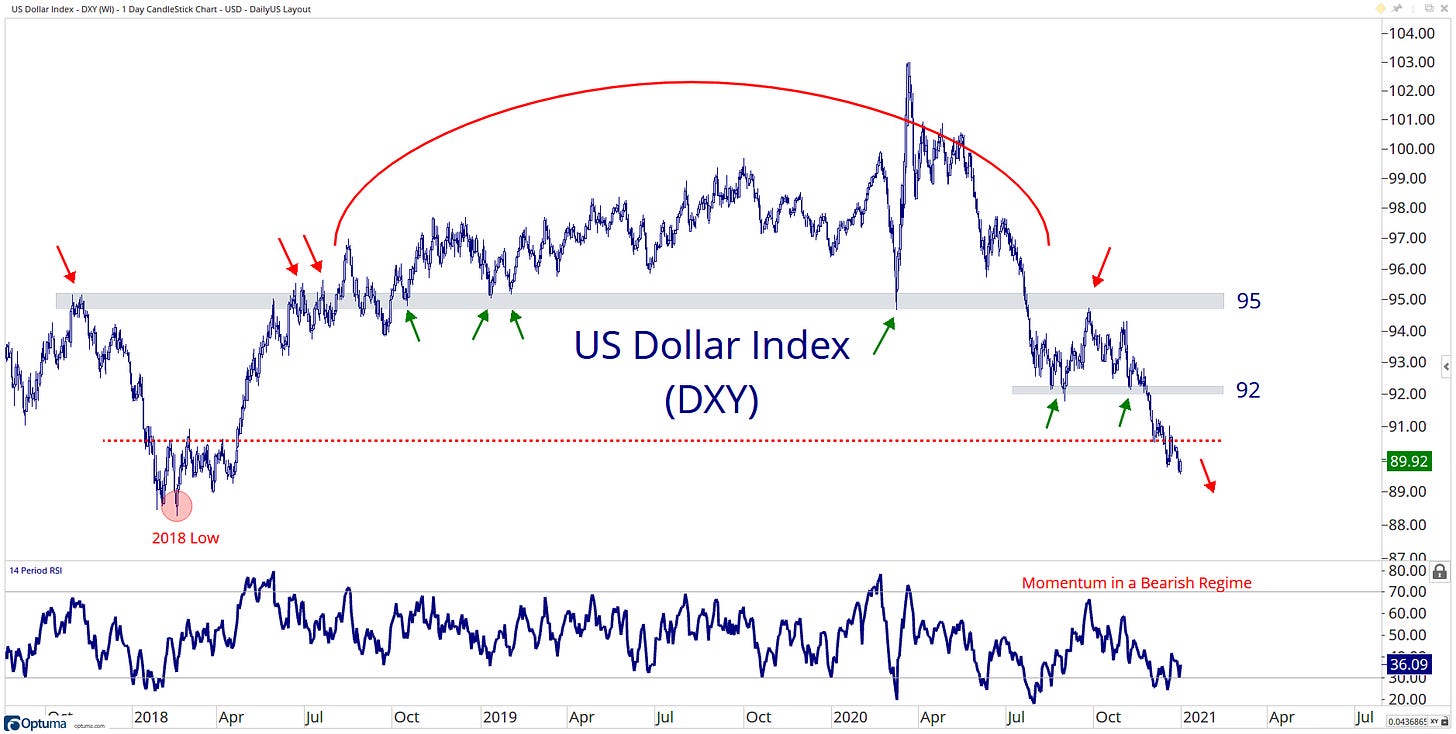
Not much support between price and those 2018 lows! Next week I might zoom out and show those 2014 lows at ~79.
Intermarket
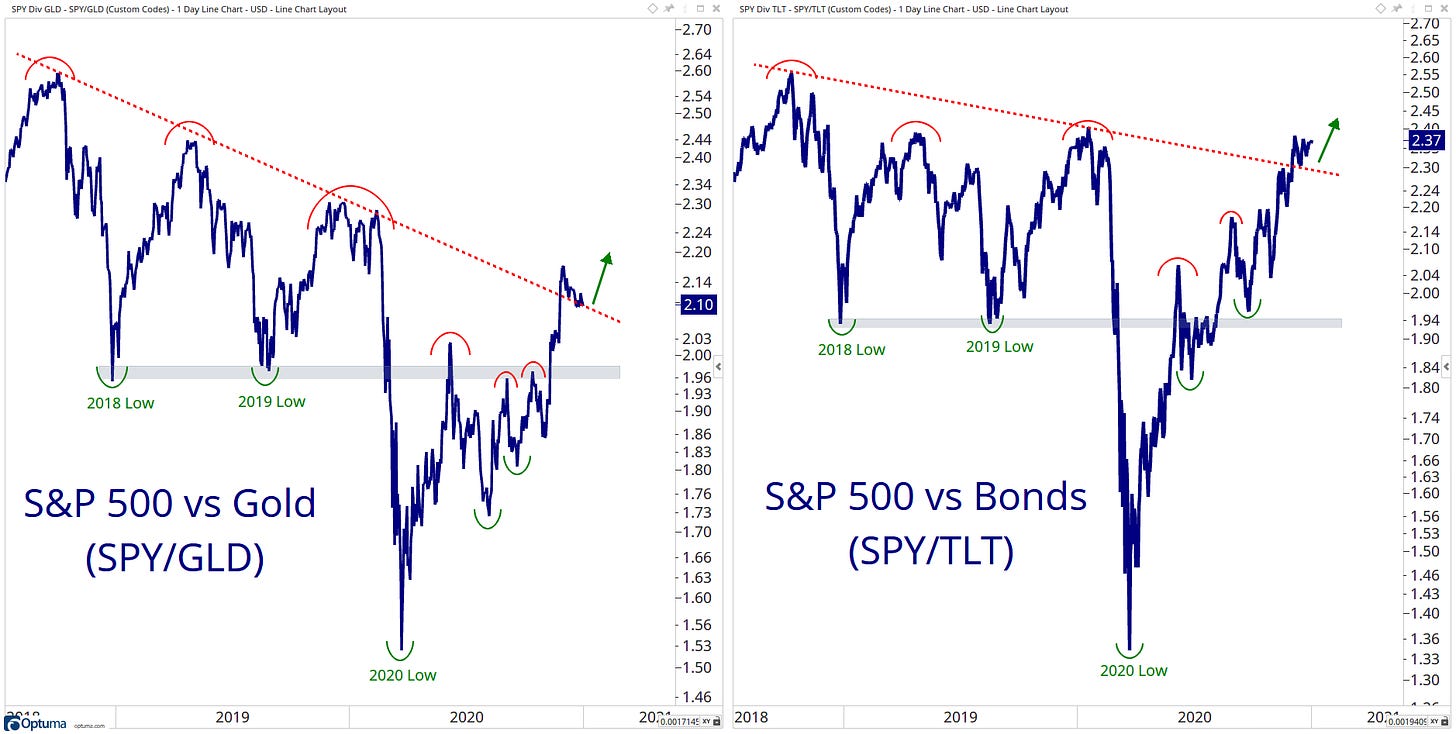
Money always flows somewhere, especially where it is treated best, so how are stocks performing against their alternatives?
For now, the short trend is in favour of Stocks over Gold and Bonds, will we see a Higher High in 2021? I am leaning towards yes.
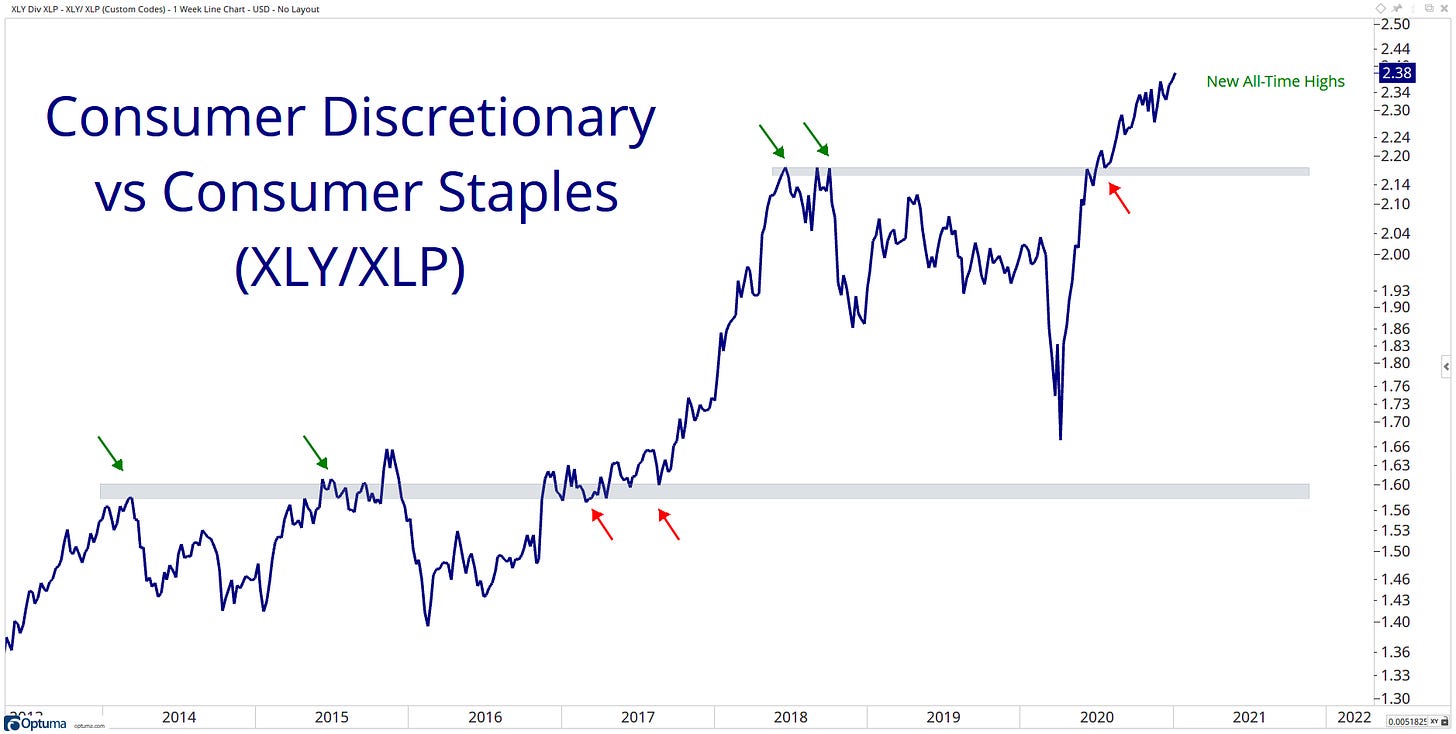
Another daily close at an all-time high for one of my favourite ratios...
These highs in Discretionary stocks relative to safe-haven Staples tells me that investors would rather be in higher beta stocks than quality, low vol and high dividend areas of the market.
Factor
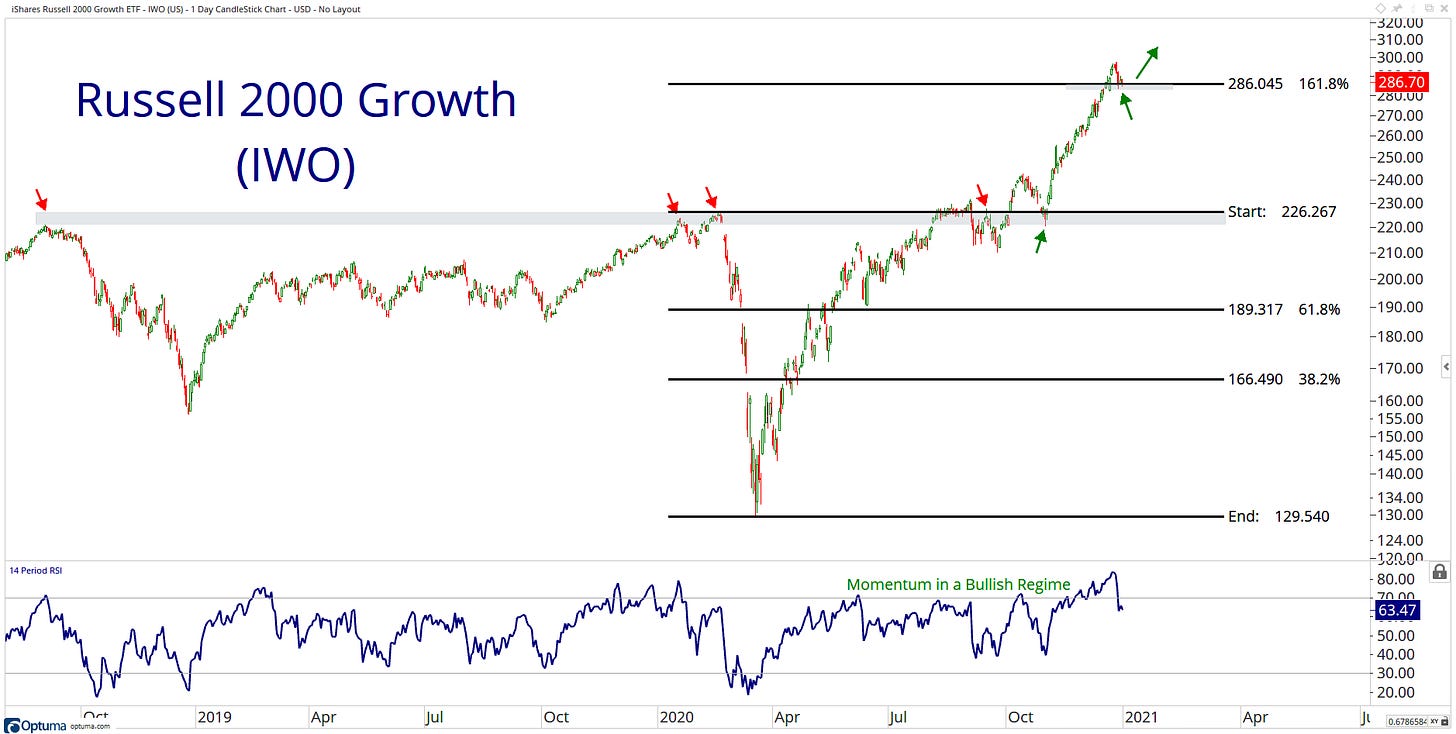
Small-Cap Growth is pumping on my cylinders.
Breadth
On a market cap level, AD line breadth is confirming all-time highs in absolute prices.
Themes
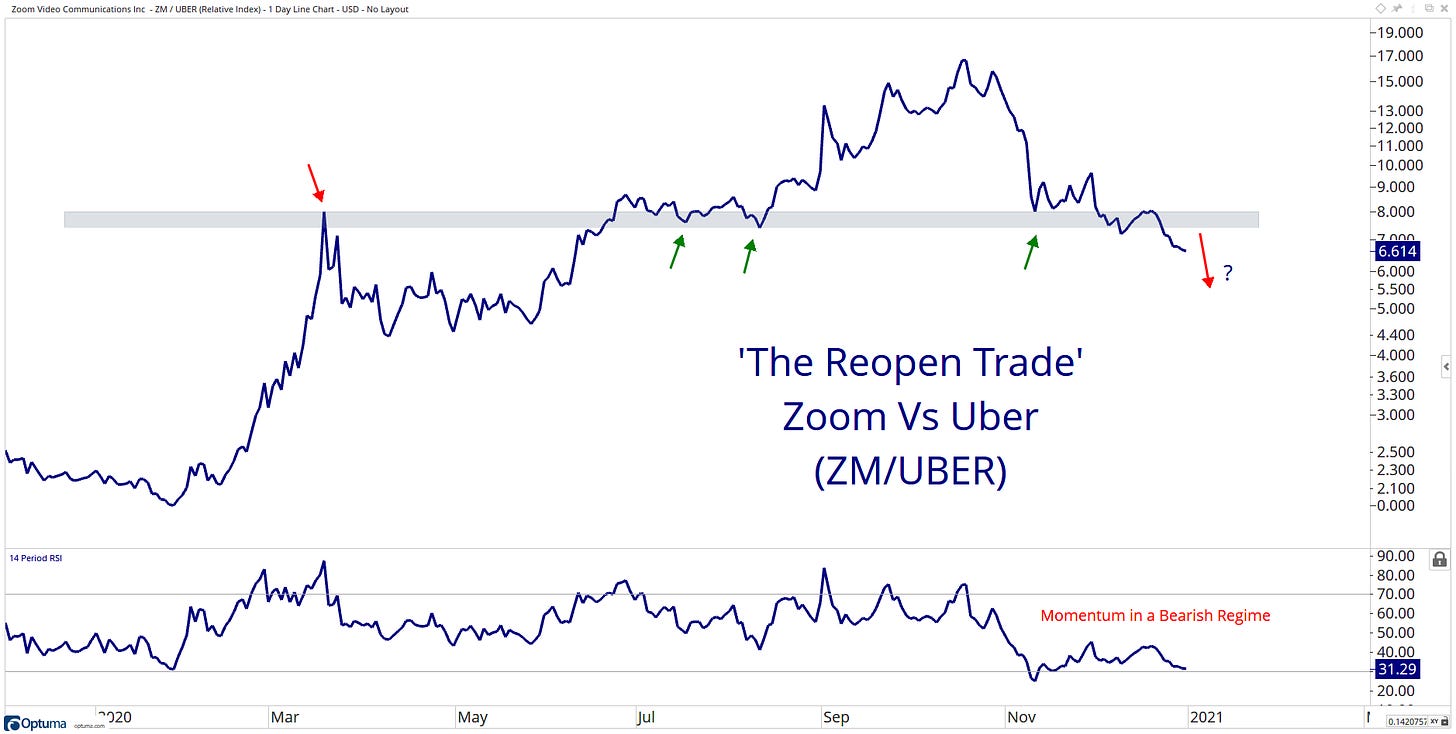
Are you still working from home?
That’s a wrap for today, hope you enjoyed my charts, and please don’t forget to share your ideas in the comment section or get in contact with me on Twitter @granthawkridge.
Stay safe and good luck out there…
GH
P.S. I also made a snowman.
DISCLAIMER: The information included in this report are obtained from sources which Jotting on Charts believes to be reliable, but we do not guarantee its accuracy. All of the information contained herein should be independently verified and confirmed. All opinions expressed by Jotting on Charts are for informational purposes only. Jotting on Charts is not a financial advisor, and this does not constitute investment advice nor any opinions expressed, constitute a solicitation of the purchase or sale of any securities or related financial instruments. Jotting on Charts is not responsible for any losses incurred from any use of this information. Do not trade with money you cannot afford to lose. It is recommended that you consult a qualified financial advisor before making any investment decisions.


