It sure has been a quick minute since my last post… been busy with life… let's not waste any more time and let’s get stuck into posting some charts on my blog!! Starting with me sharing my favourite high-level charts from my weekend charting session.
World
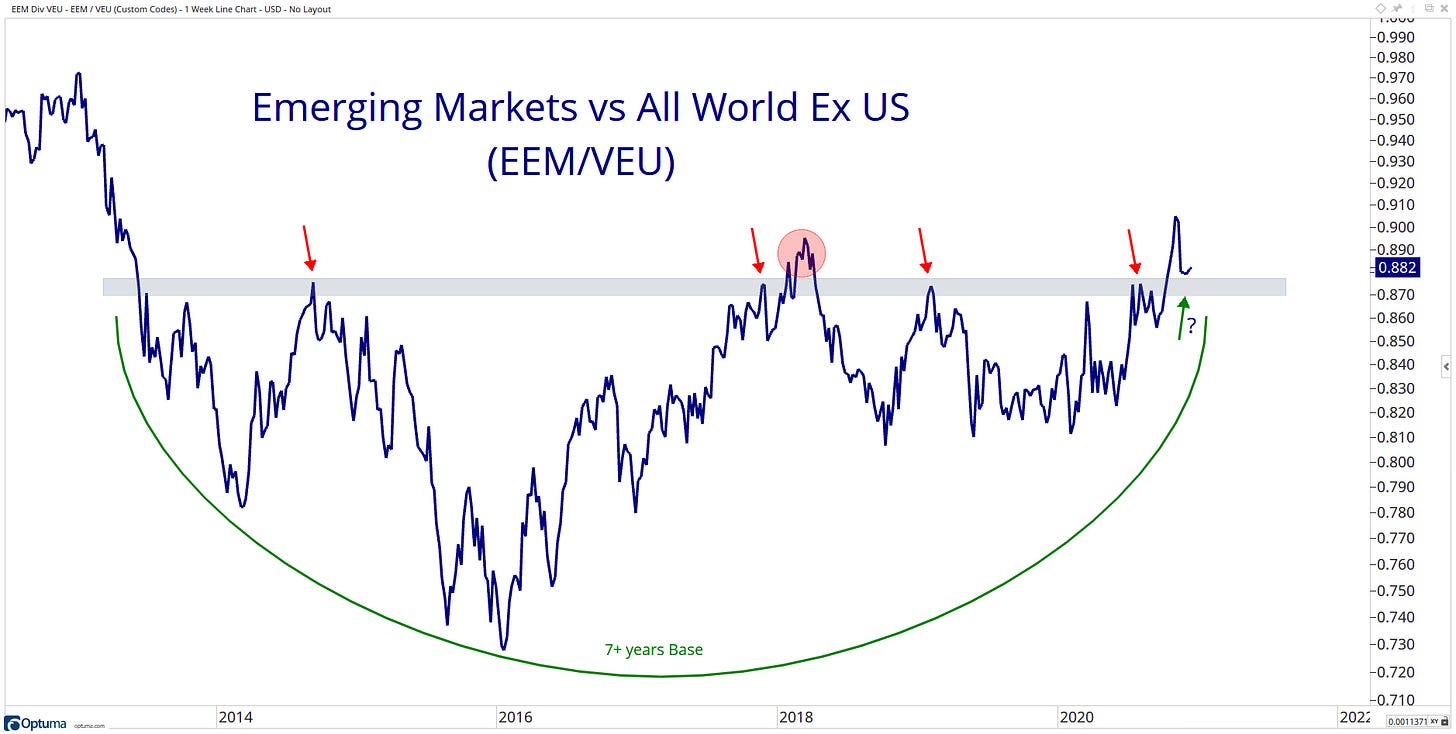
let us start with a look at Emerging Markets $EEM, is attempting to retest its breakout level of a long-term base relative to the All-World Ex-US Index $VEU.
For me, this ratio serves as one of many gauges of risk appetite on a global scale. Holding above the breakout level in this ratio would be logical that we see higher stock prices. However, if the ratio breaks back below this level, I would expect it to continue to move sideways in the near-term.
US
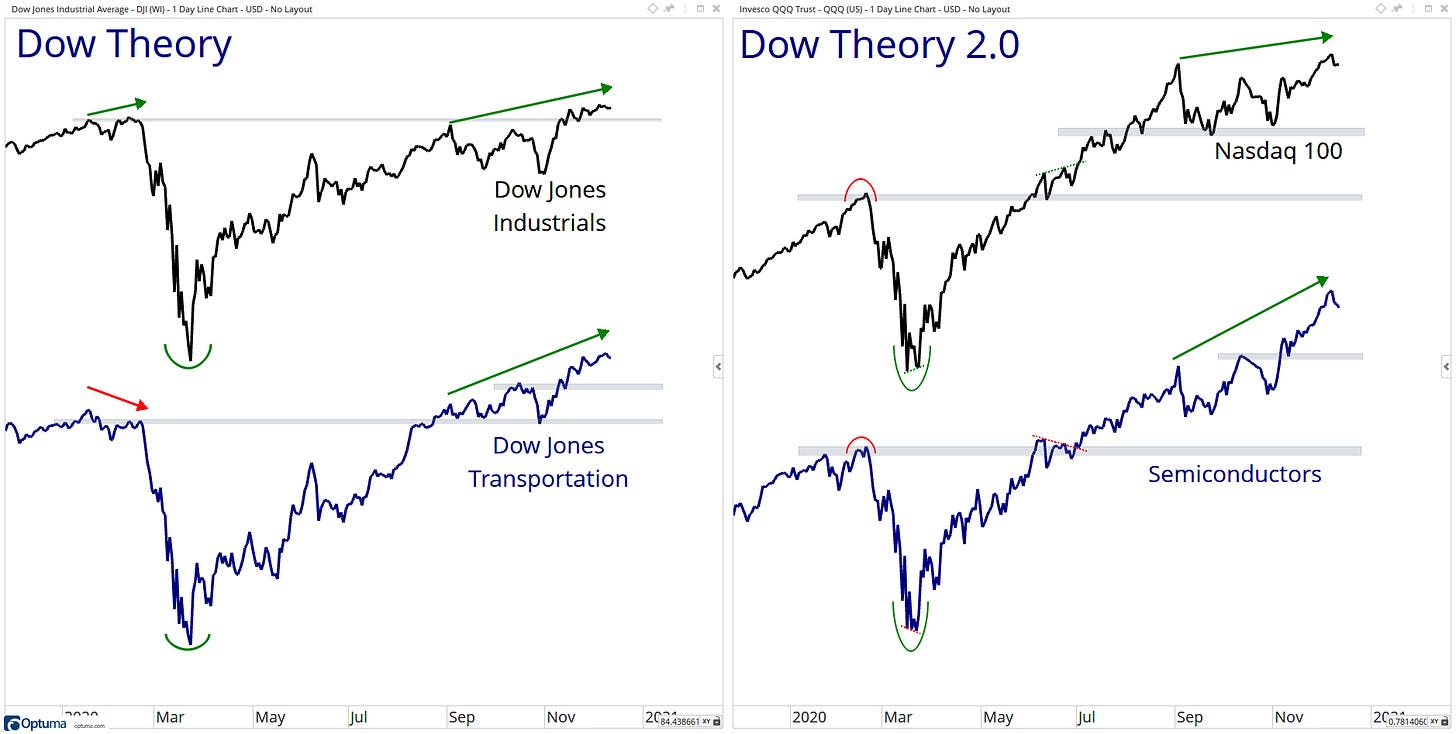
The trend in the US is up, Higher Highs & Higher Lows it’s that simple. KISS!
US Sectors
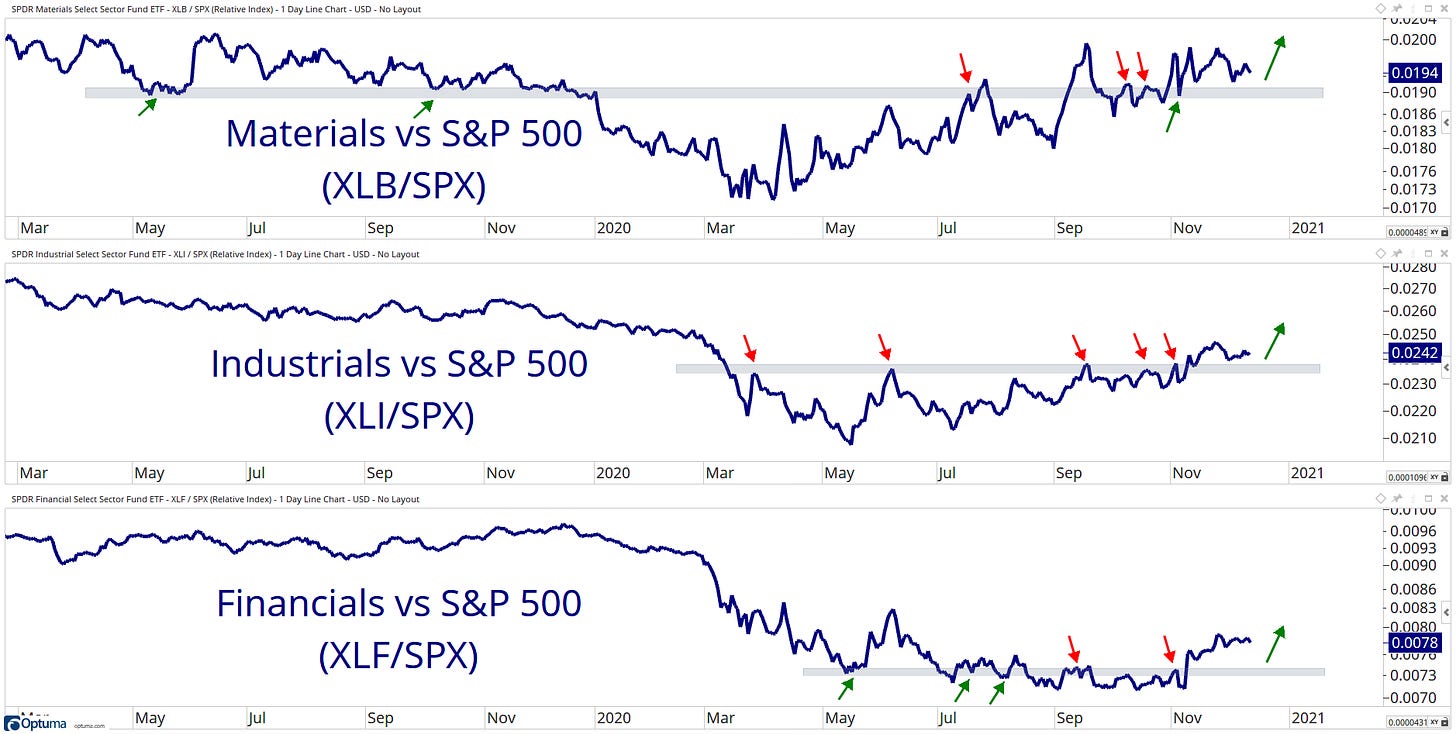
Cyclical sectors ($XLB $XLI $XLF) holding above critical levels of support which were once resistance levels.
US Industries
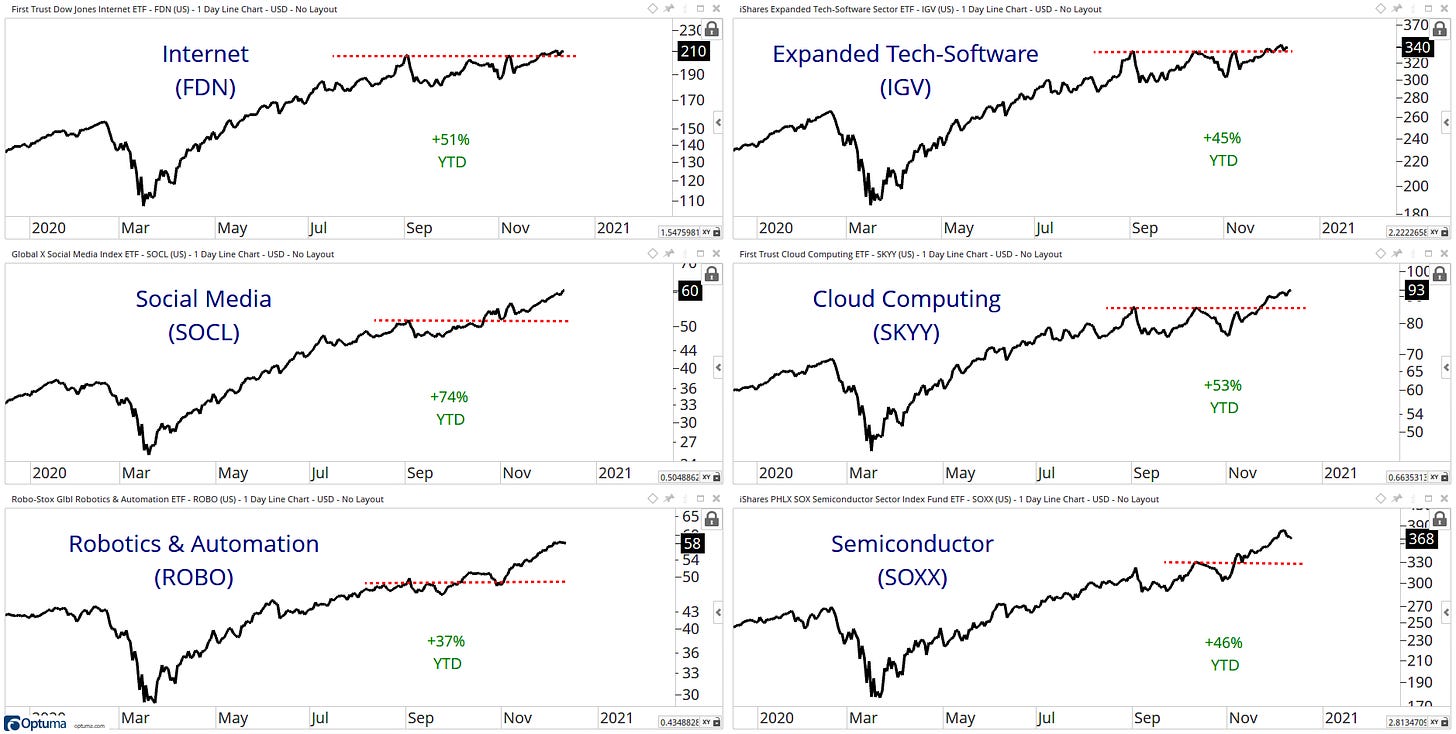
Mainstream media has been spruiking that technology stocks are not working, they might correct that large-cap stocks are having a ‘rest’, but if you do the work and look beyond the big tech boys, there is still lots of mid-, small-, and micro-cap tech stocks pushing higher! Just take a look at these tech industries at or near all-time highs!
Fixed Income
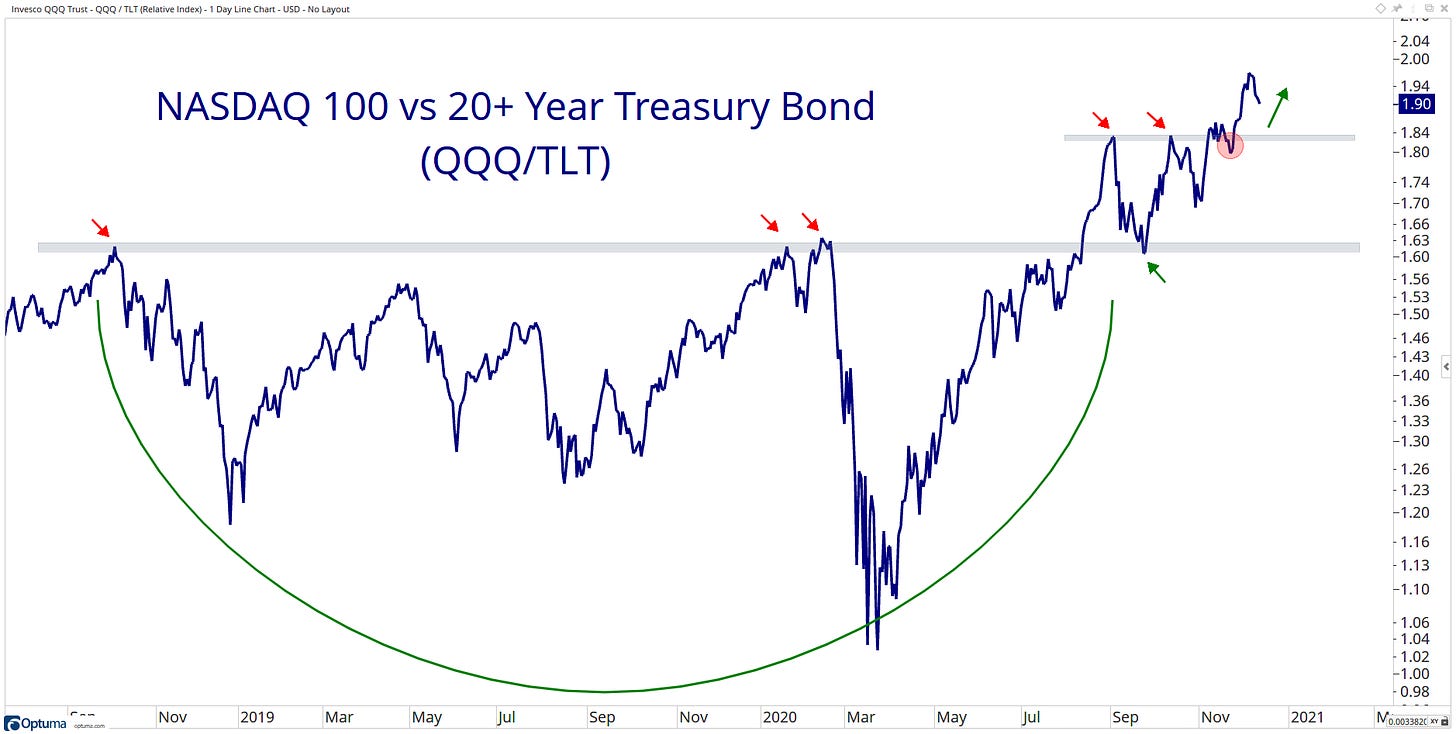
Here is a chart of the Nasdaq 100 $QQQ relative to Treasuries $TLT.
Hanging out at all-time highs after breaking out of a base this summer continues to remind us that the ‘alpha’ remains in the stock market.
Commodities
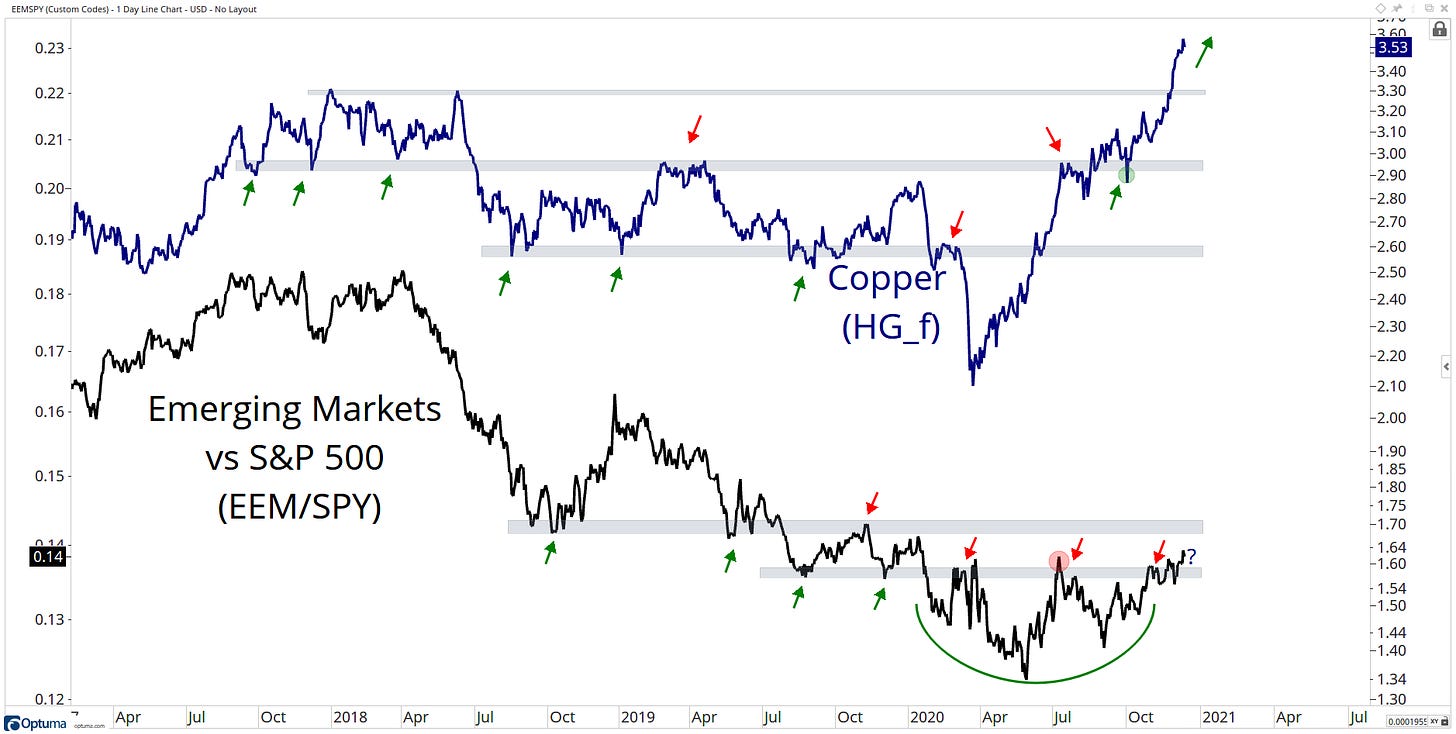
Copper on an absolute basis has a strong positive relationship with the outperformance of Emerging Markets $EEM. However, for much of this year, they have been diverging from one another.
Copper continues to grind higher and is now comfortably above its risk level of $3.
So, will Copper reverse down or will Emerging Markets relative put in some substantial outperformance? Is it’s finally time for the decade-long underperformance from Emerging Markets to come to an end? We will have to be patient and weigh each new data point as it comes in.
Currencies
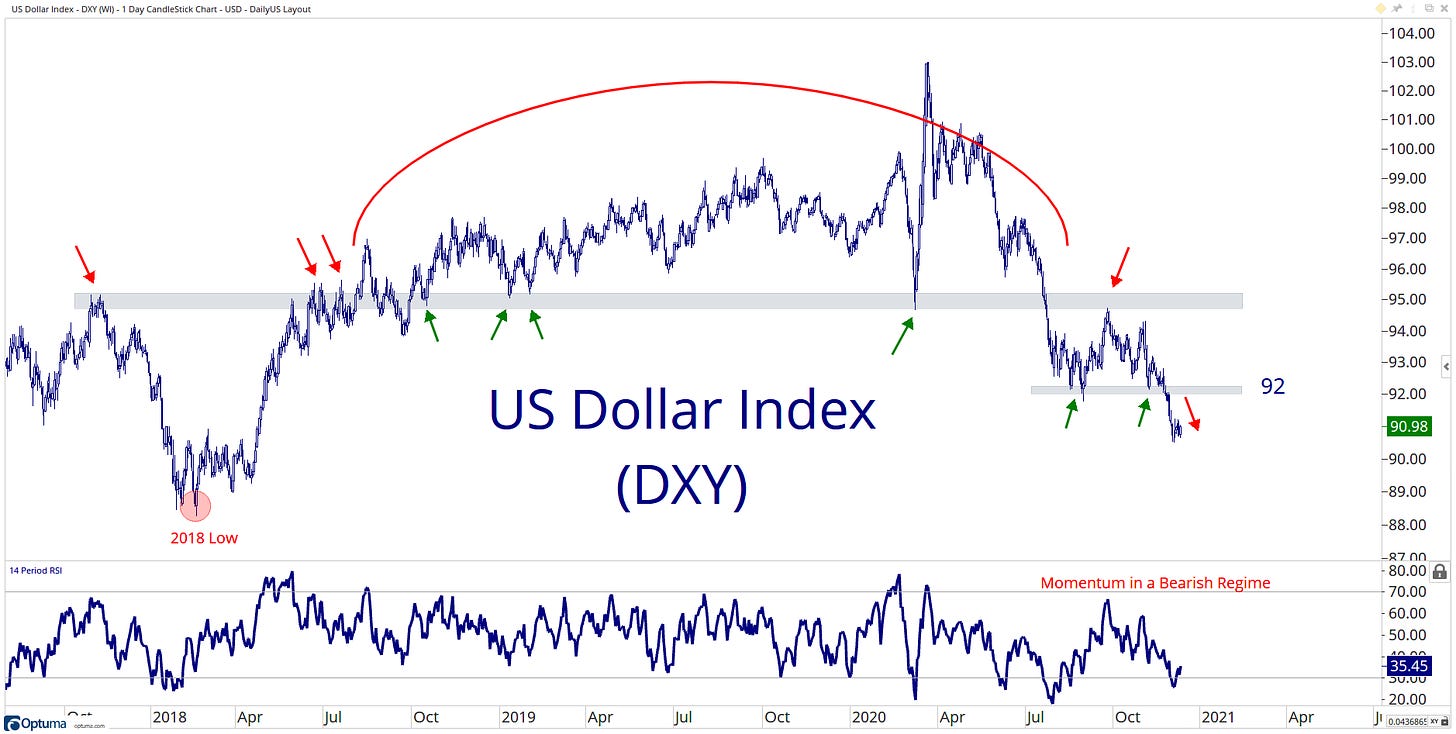
US Dollar Index has broken to the downside and was not able to hold above key support at around 92. A move to test its 2018 lows seems like the most probable outcome, especially when I weigh the evidence (Higher highs and higher lows for cyclical and risk assets).
Intermarket
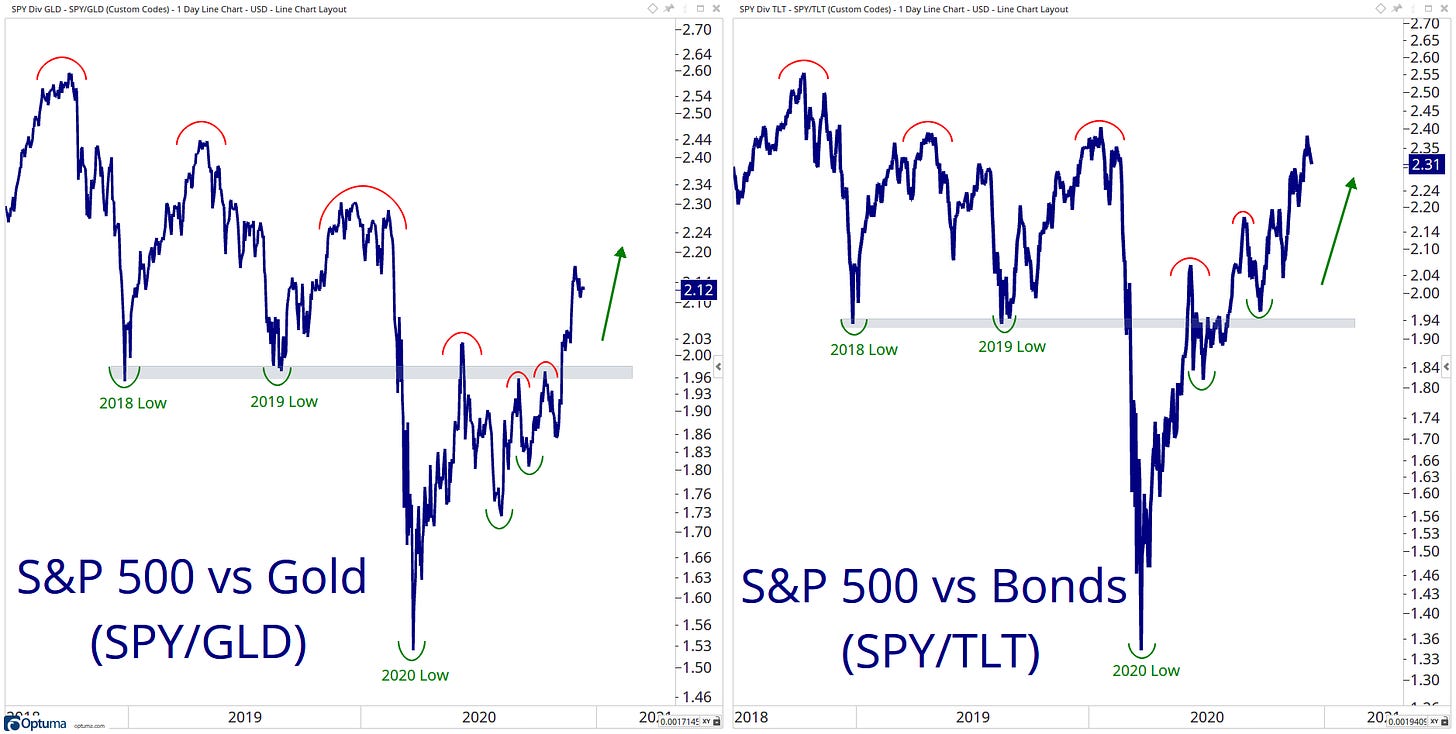
One of my favourite charts to look at is stock relative to both gold and bonds. Money always flows somewhere, especially where it is treated best, so how are stocks performing against their alternatives?
For now, the short trend is in favour of Stocks over Gold and Bonds, will we see a Higher High, which might be an excellent start to 2021?
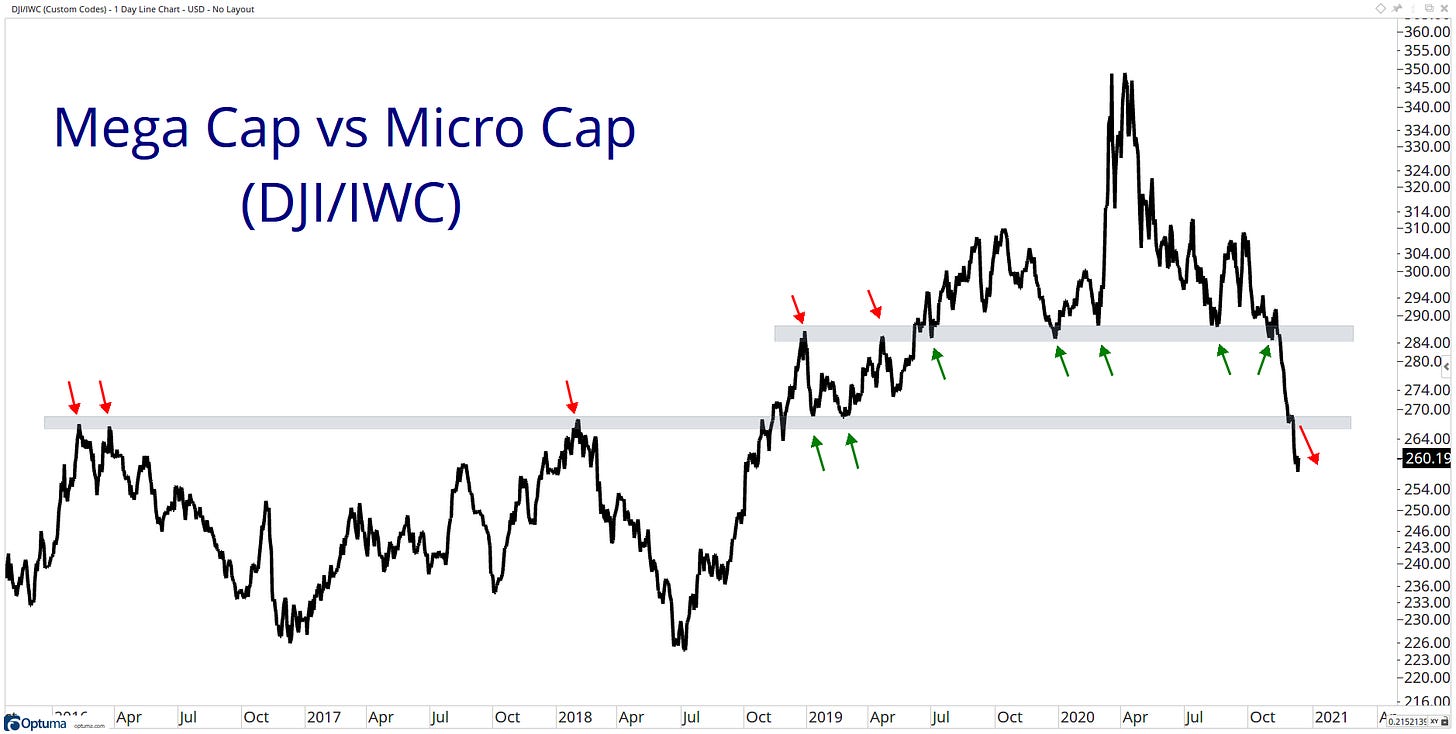
Factor
Here is a chart that speaks to improving participating. The early 2020 narrative that Mega-Cap and Tech were the only areas participating and pushing the market higher is simply not true. Since the March highs, Micro-Caps have aggressively outperformed Mega-Cap stocks. Seeing these smaller companies outperform the largest companies in the world not only speaks to a continuing expansion in participation but also risk-appetite.
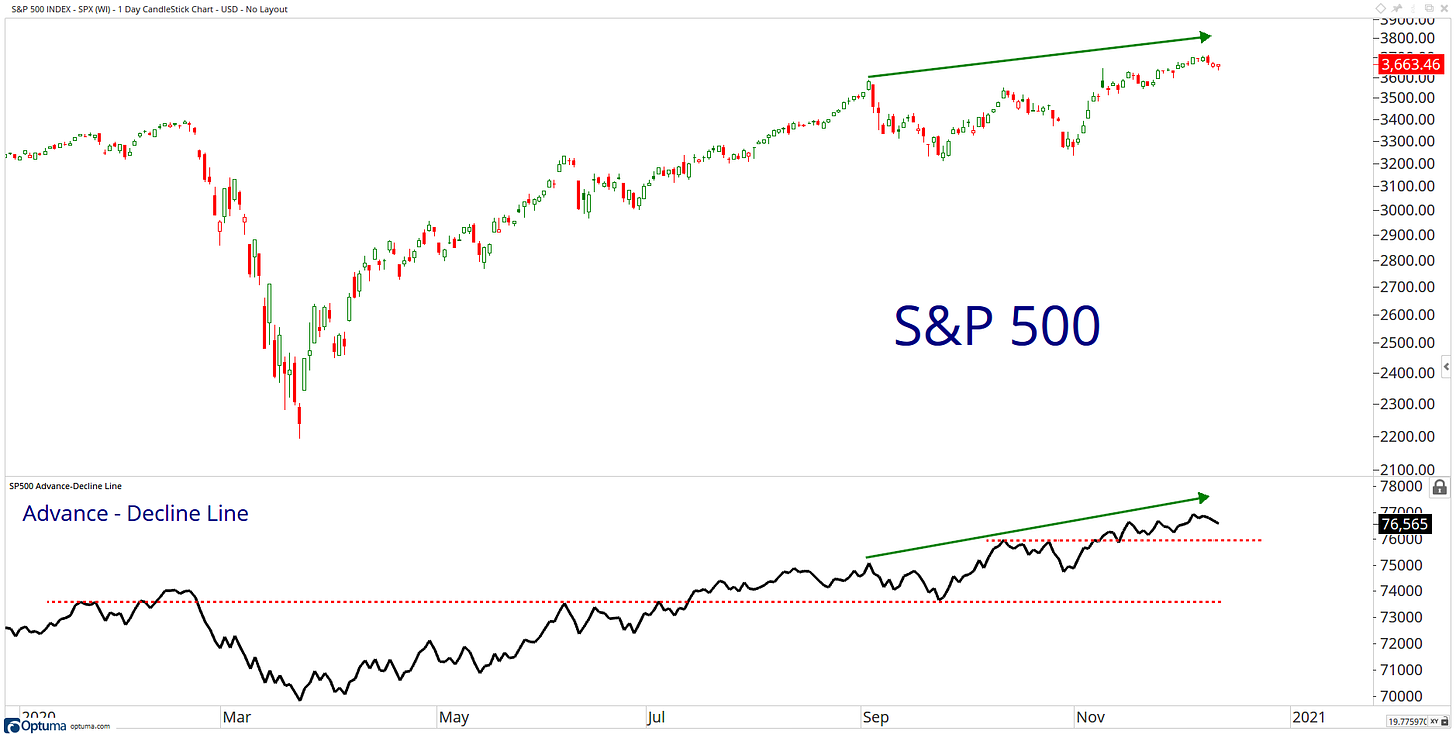
Breadth
Keeping this one simple… Price and breadth are confirming each other!
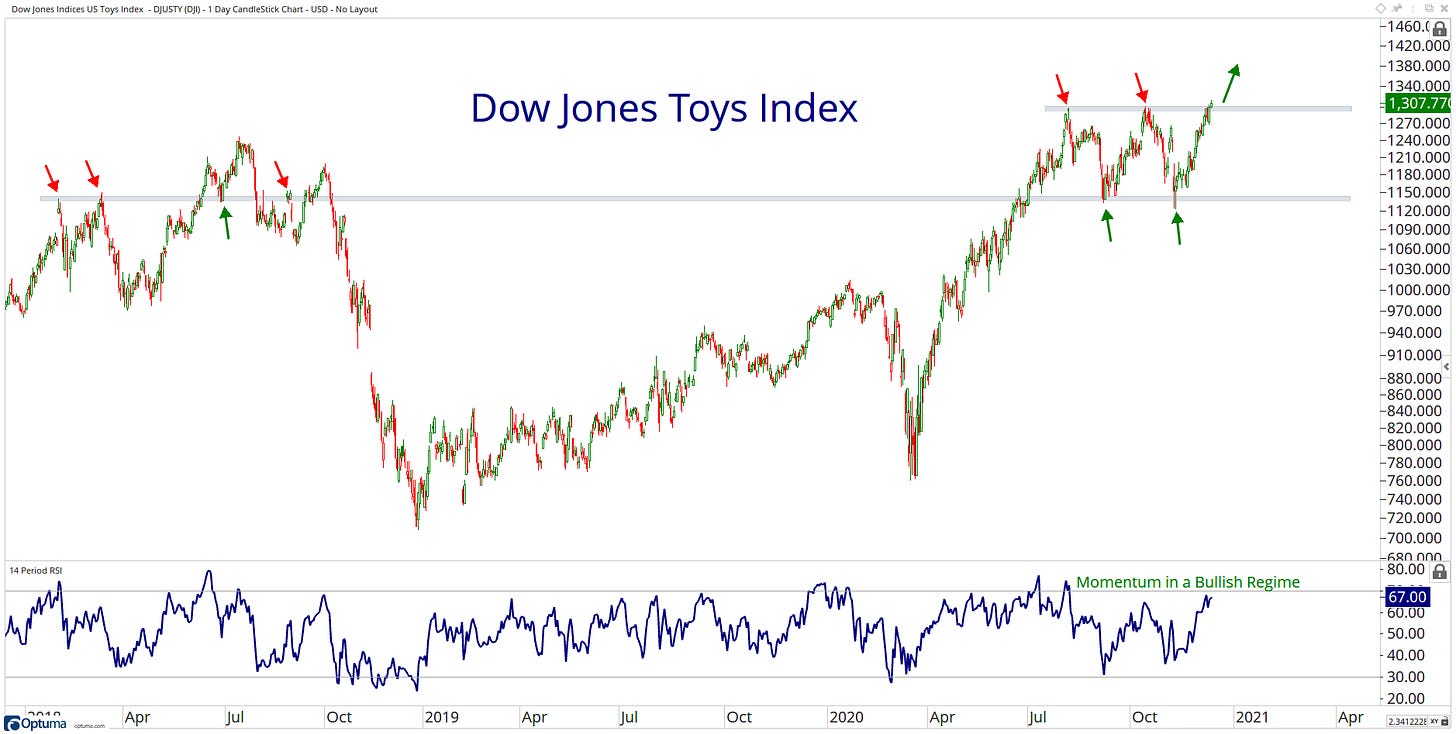
Themes
11 days till Christmas… Breakout for the Dow Jones Toys Index, now will we see follow through with strong holiday sales?
That’s a wrap for today, hope you enjoyed my charts, and please don’t forget to share your ideas in the comment section or get in contact with me on Twitter @granthawkridge.
Stay safe and good luck out there…
GH
DISCLAIMER: The information included in this report are obtained from sources which Jotting on Charts believes to be reliable, but we do not guarantee its accuracy. All of the information contained herein should be independently verified and confirmed. All opinions expressed by Jotting on Charts are for informational purposes only. Jotting on Charts is not a financial advisor, and this does not constitute investment advice nor any opinions expressed, constitute a solicitation of the purchase or sale of any securities or related financial instruments. Jotting on Charts is not responsible for any losses incurred from any use of this information. Do not trade with money you cannot afford to lose. It is recommended that you consult a qualified financial advisor before making any investment decisions.

