Welcome to Jotting on Charts. If you’re reading my little charting blog but haven’t subscribed, please join to learn more about uptrend, downtrends and everything in between alongside +380 other subscribers. Thank you to all who are following along on this journey!
If you share this with 2 of your friends who also like to look at charts, it will be GREATLY appreciated. My goal is to hit 1k subs by the end of next year! Thank you to all those who share.
It’s that time again… Let’s rise and grind!
Want to know what I am thinking? Well, check out my notes direct from my weekend scan of the markets.
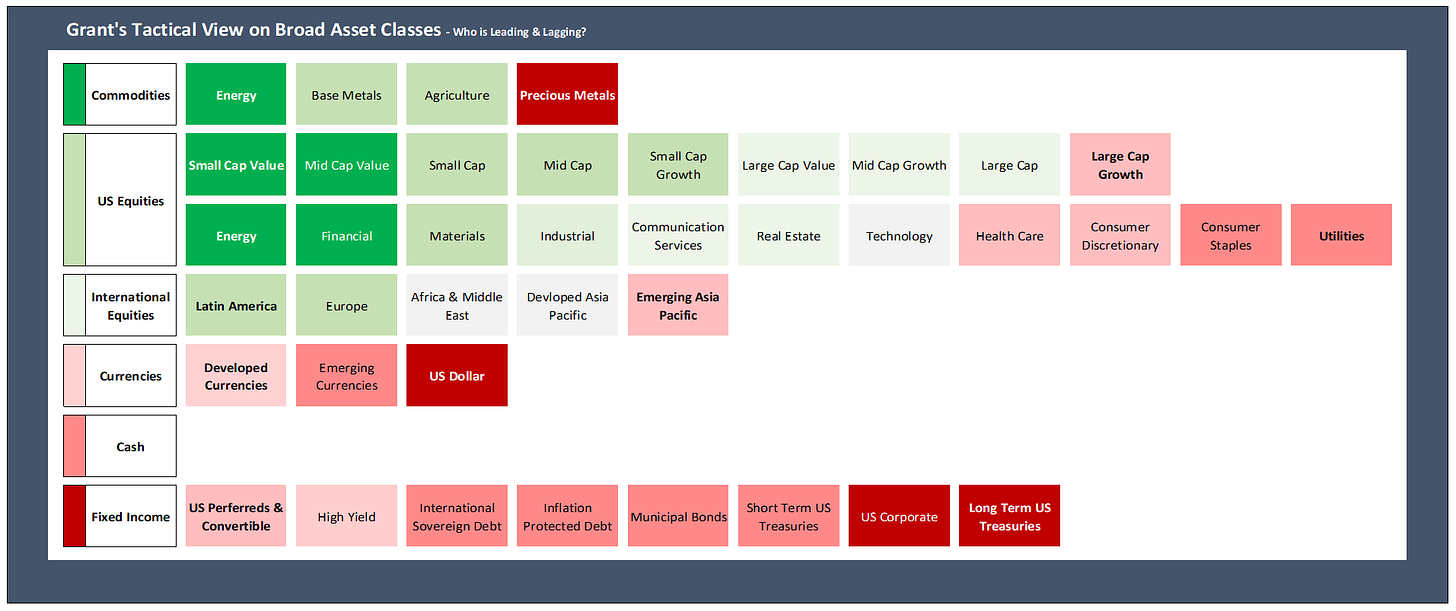
Let’s start with my tactical overview - No Change from last week.
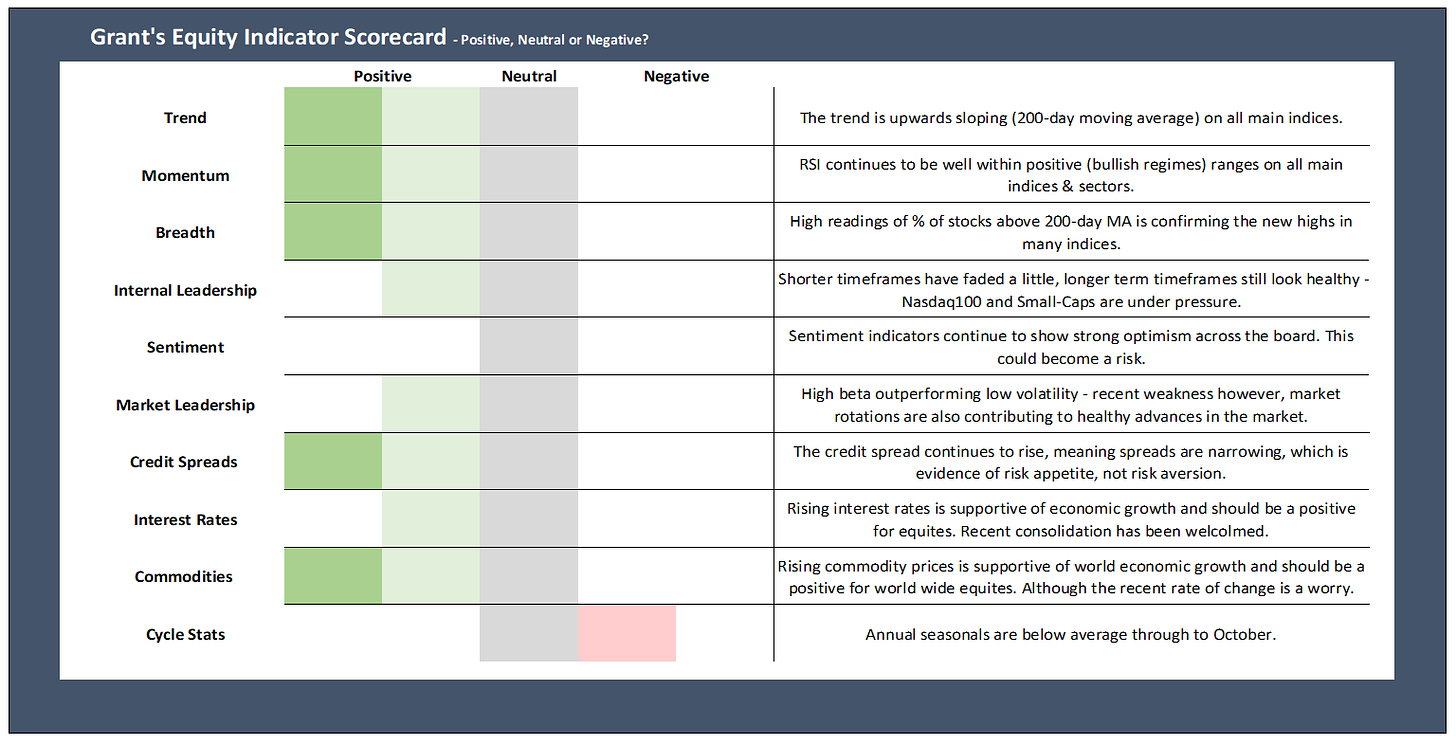
Here is my equity indicator scorecard, which is still largely positive - No Change from last week.
OK, let’s break it down a little bit more.
Commodities / Currencies
FX:
DXY continues to fade, if we see a break of 90 we might see more downside price action.
EUR is back above 50 & 200-day; Testing key resistance level.
AUD/JPY broke above key resistance; at a 3-year high.
Commodities:
CRB Index: Strong new long-term trend; broke above key resistance; at a 6-year high.
Reflation trade intact and with momentum.
Precious Metals holding its support level within a long-term uptrend.
Copper continues with its vertical movement.
Copper/Gold remains strong above critical levels. Global growth is strong.
Oil finding resistance at current levels. The level is 66.
Bonds / Rates
US Bonds:
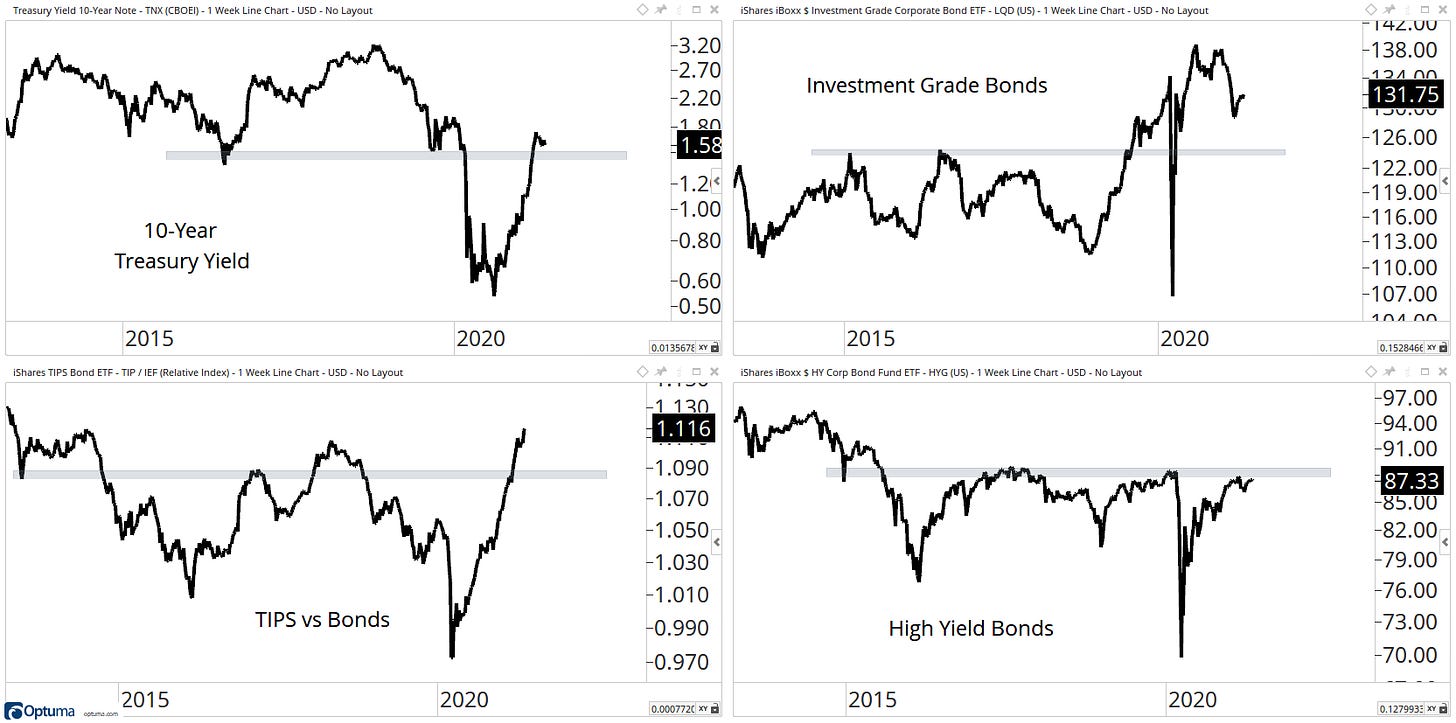
IEF finding support & bouncing; RSI at 52 (Within a bearish regime)
TIP continues to grind higher
TIP is at a new multi-year high relative to IEF.
LQD found a support level.
Still a supportive environment for stocks and risk assets more broadly.
The trend continues to favour high yield over high quality.
All this continues to confirm the reflation trade.
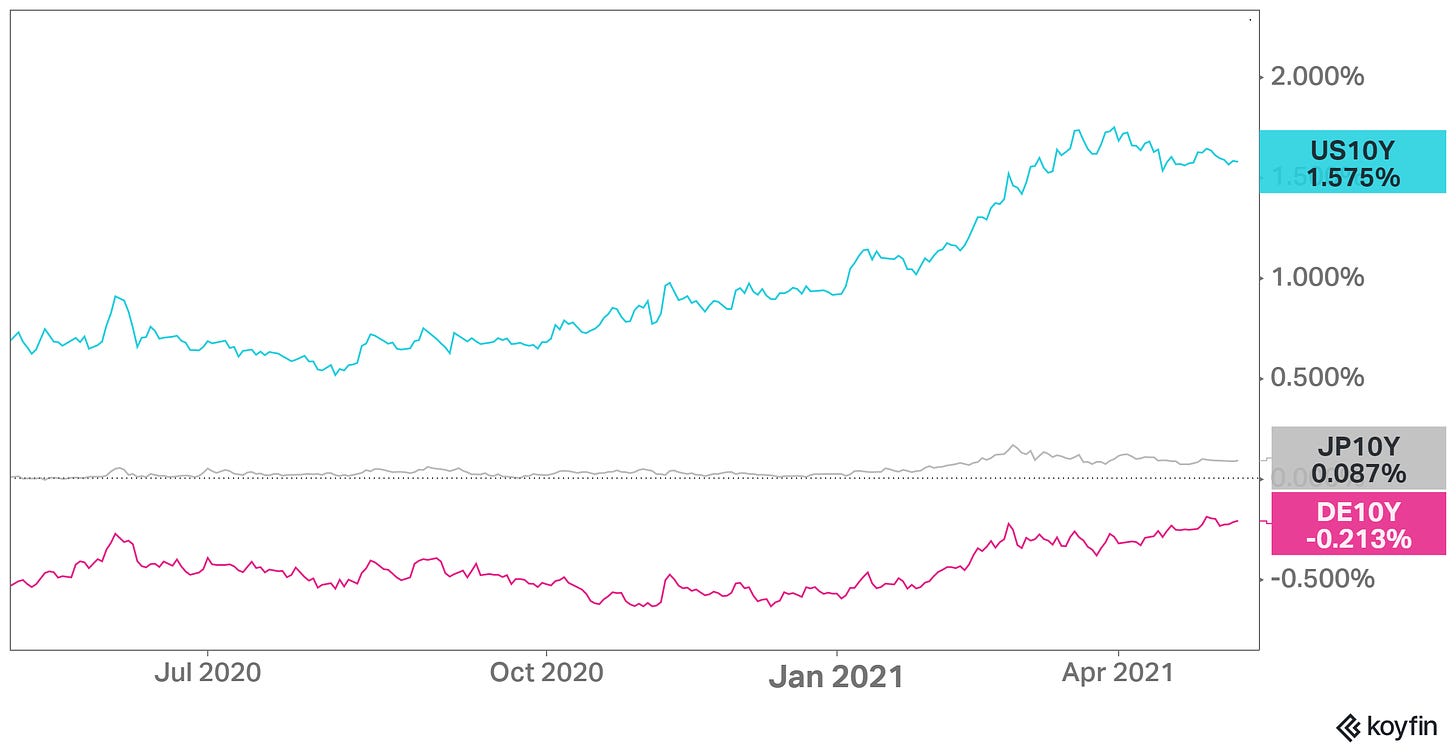
Global & US Yields:
TNX holding above 1.40%; probability looks like its heading to 2%
Yields globally grinding sideways
US requires support from JP & DE to move higher
The curve continues to steepen
Overseas Markets
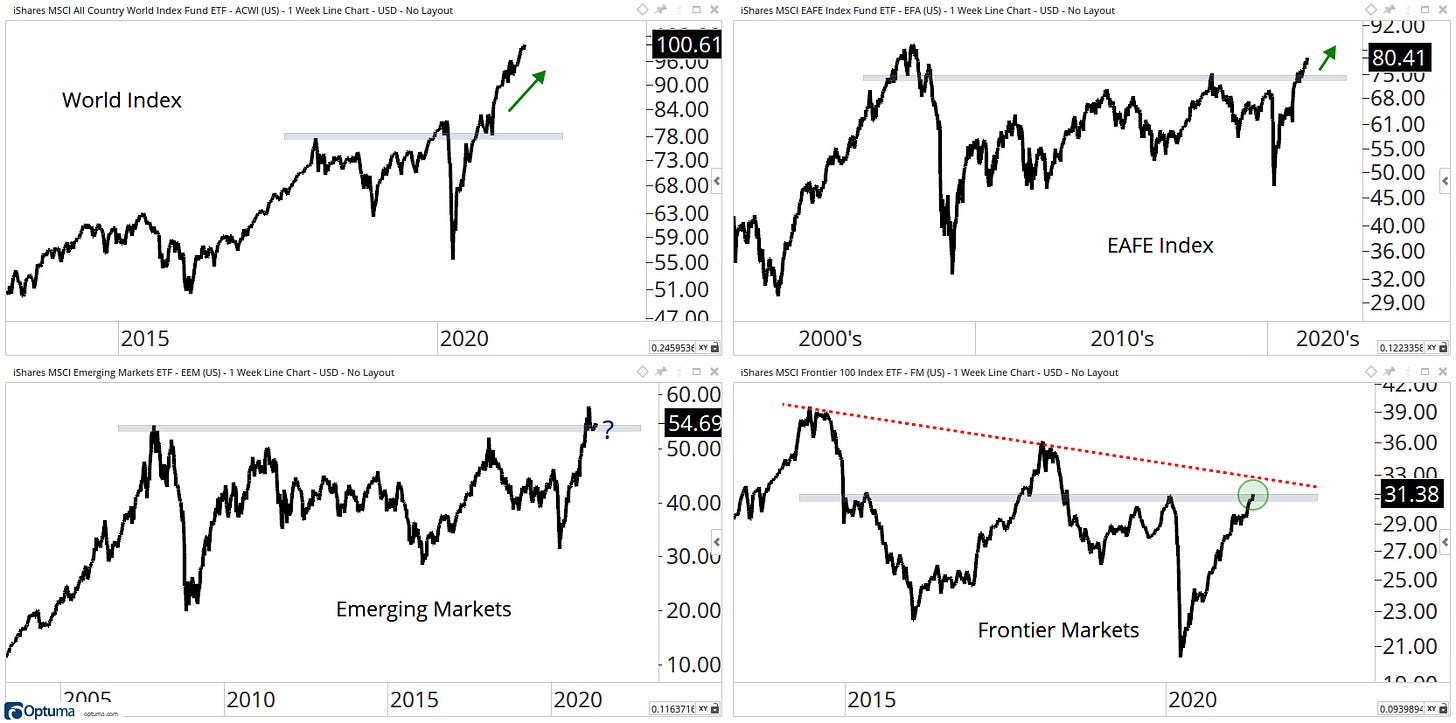
Broad Indices:
89% of global markets are in Bullish regimes, 9% with extreme readings.
Developed markets continue to look healthy technically, longer-term.
Developed taking the leadership role.
Emerging markets showing short term weakness in relative strength.
A mix of leading and lagging within emerging markets.
Frontier markets at a key level.
85% of the global markets were positive last week.
74% of the global markets are within 5% of 52-week highs.
Countries:
DAX: 0.7% off all-time highs.
UK: Momentum is overbought(70) new 52-week highs last week.
France: Continuing its move with strong momentum.
Japan: Consolidation continuing; Weakening relative strength
China: Holding above support and 200-day
India: Consolidating; Weakening relative strength and momentum
Russia: 52-week highs.
Brazil: Back above 50 & 200-day MA.
US Stock Market
Index:
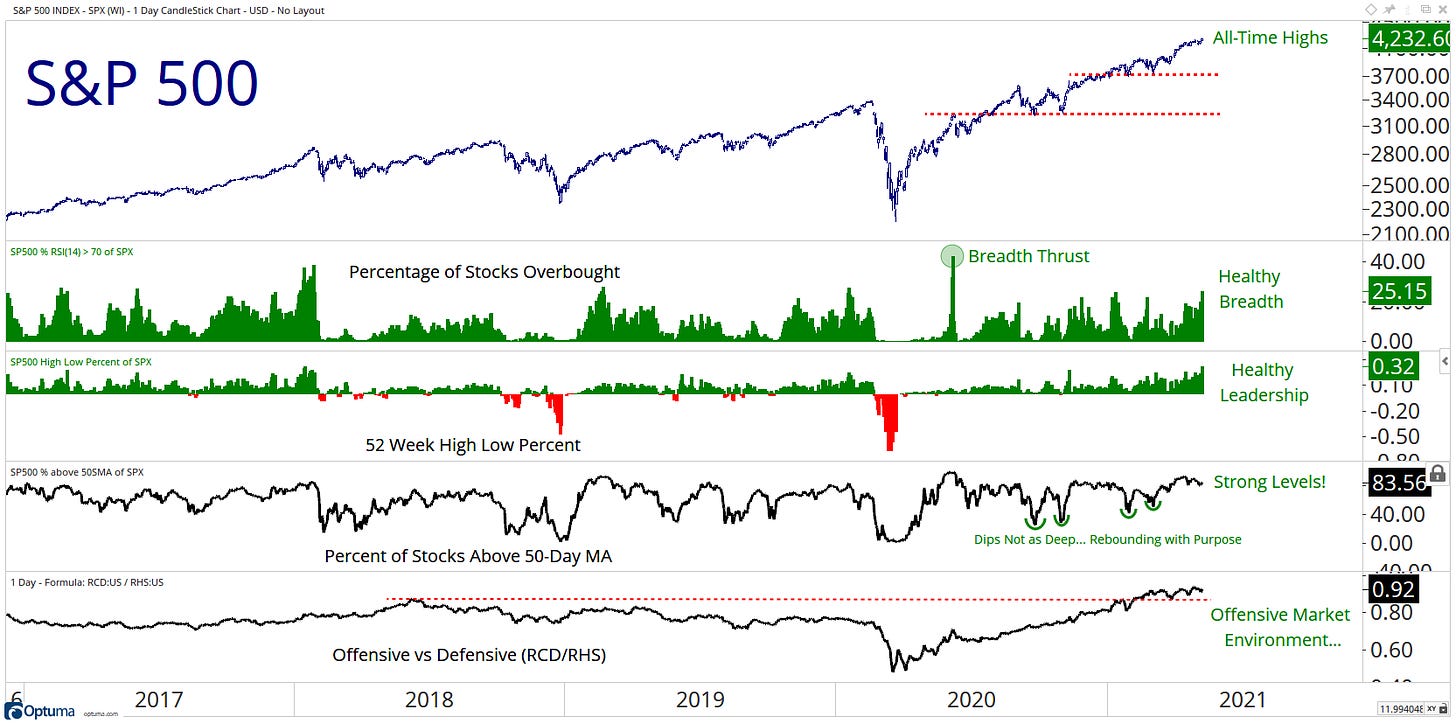
S&P scored a new all-time high – holding above 4,000
The short-term trend is up – bulls are in charge
Strong breadth and leadership which is a huge positive for the longer term
It continues to look like a cyclical bull market
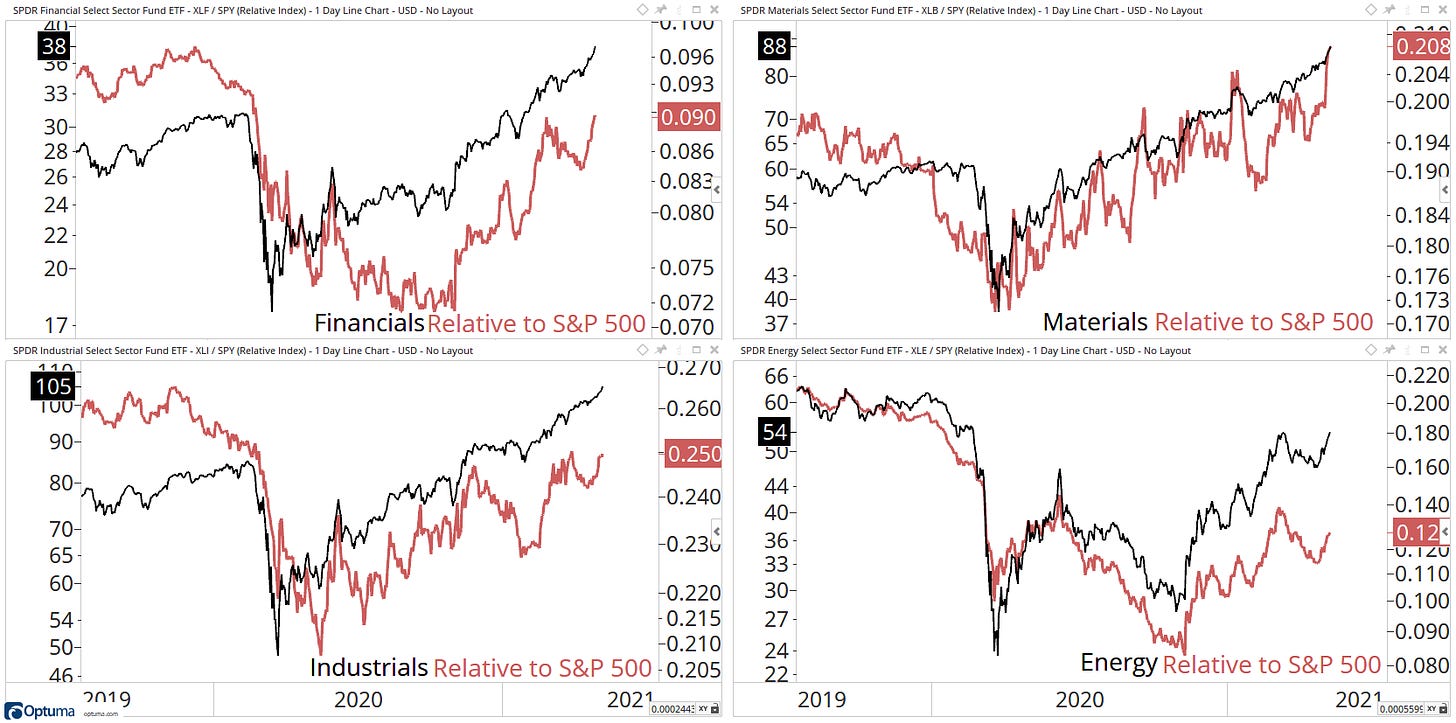
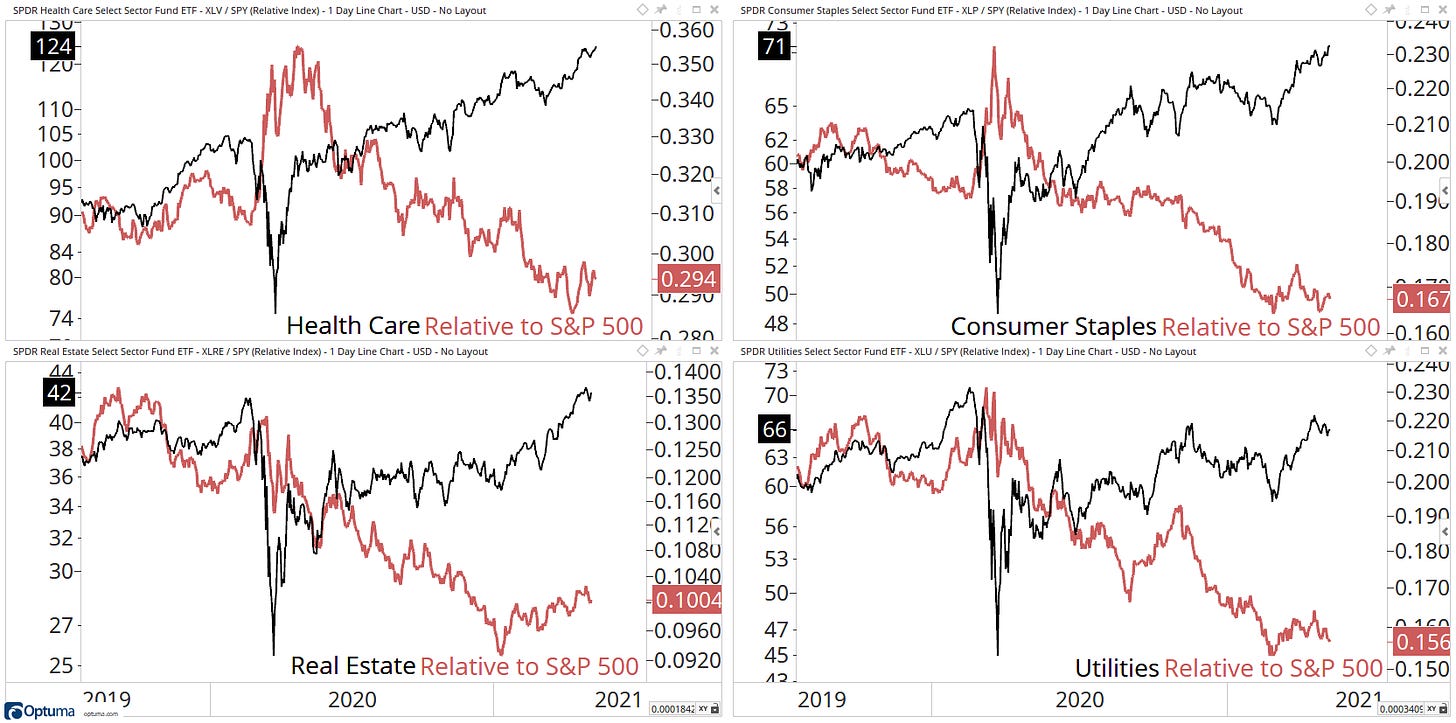
Rotation & broadening is still clearly evident
Mid and Large-Cap leading the team still, an improvement from small-caps
Stocks in a ‘Confirmed’ Bull Market
S&P500 breadth and leadership is healthy
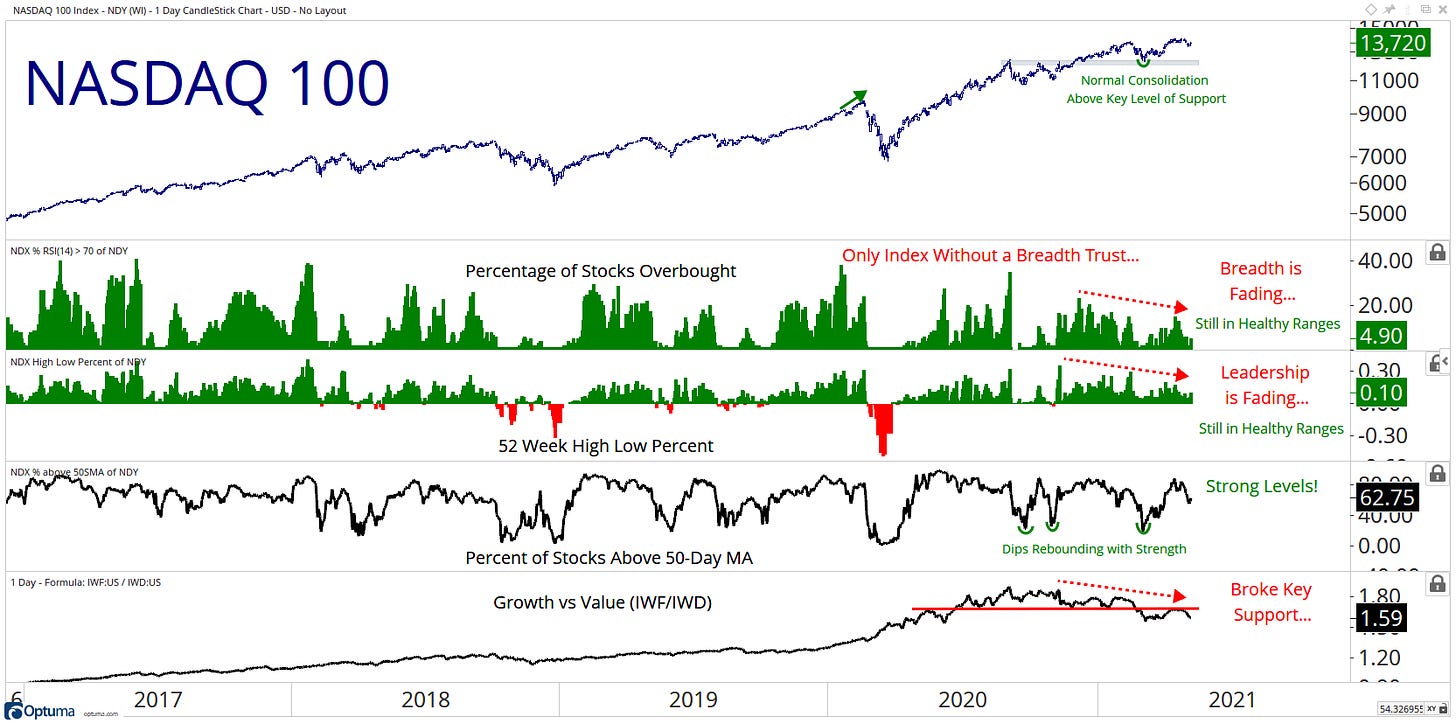
Nasdaq100 breadth and showing more signs of weakness!
Mixed Sentiment & seasonality remain risks
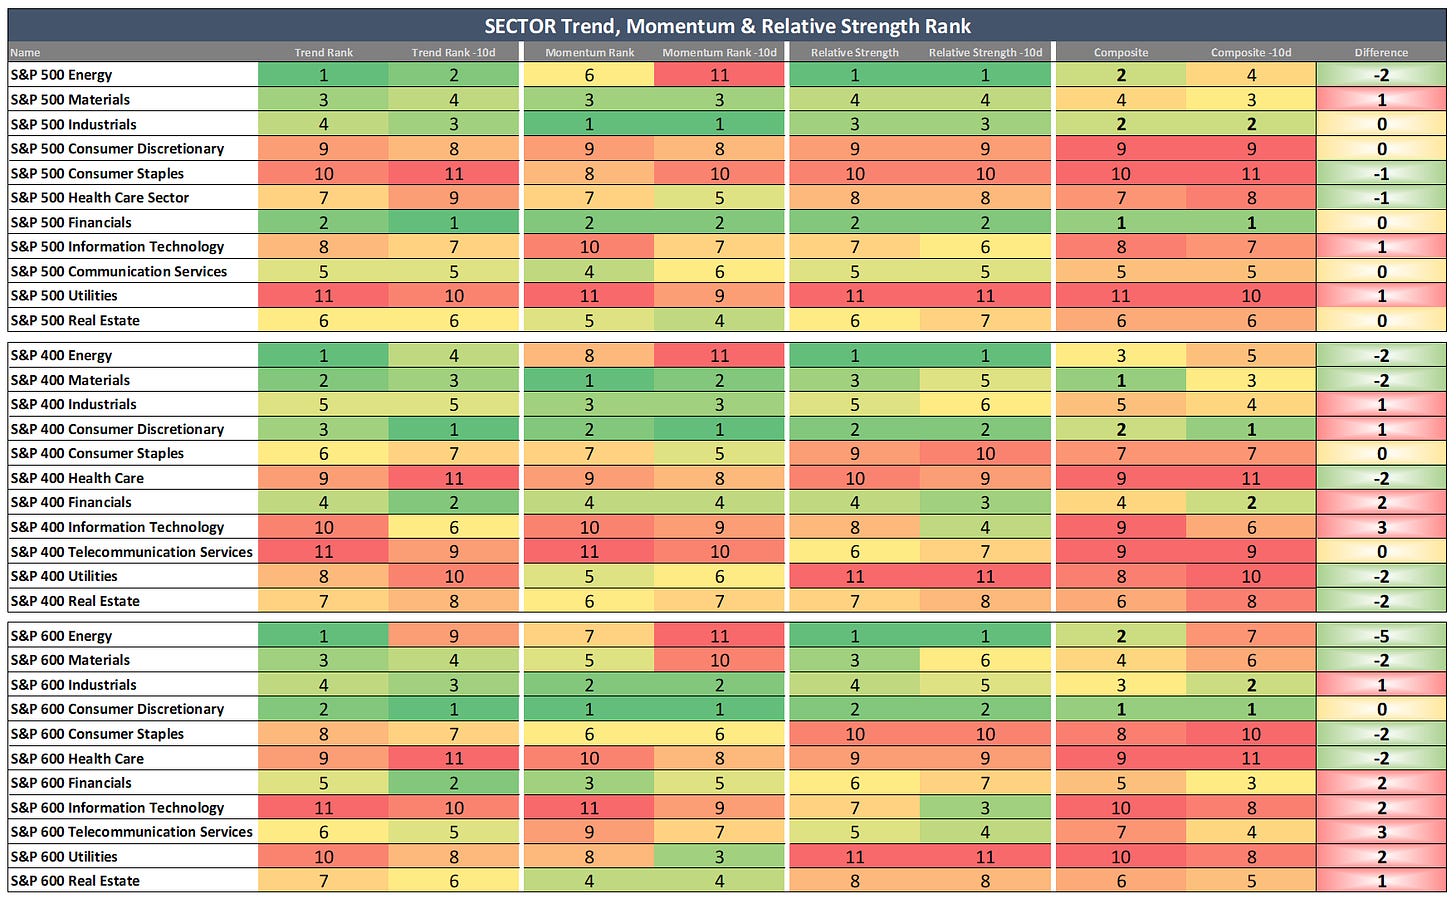
US Large, Mid and Small-cap Sectors:
100% are in a Bullish Regime, 19% are in extreme readings.
All Sectors in a ‘Confirmed’ Bull Market.
74% had a positive percentage change week
47% Made 52-week highs last week.
Small-Cap still lagging although improving.
87% are within their 52-week highs.
57% closed higher than last weeks high.
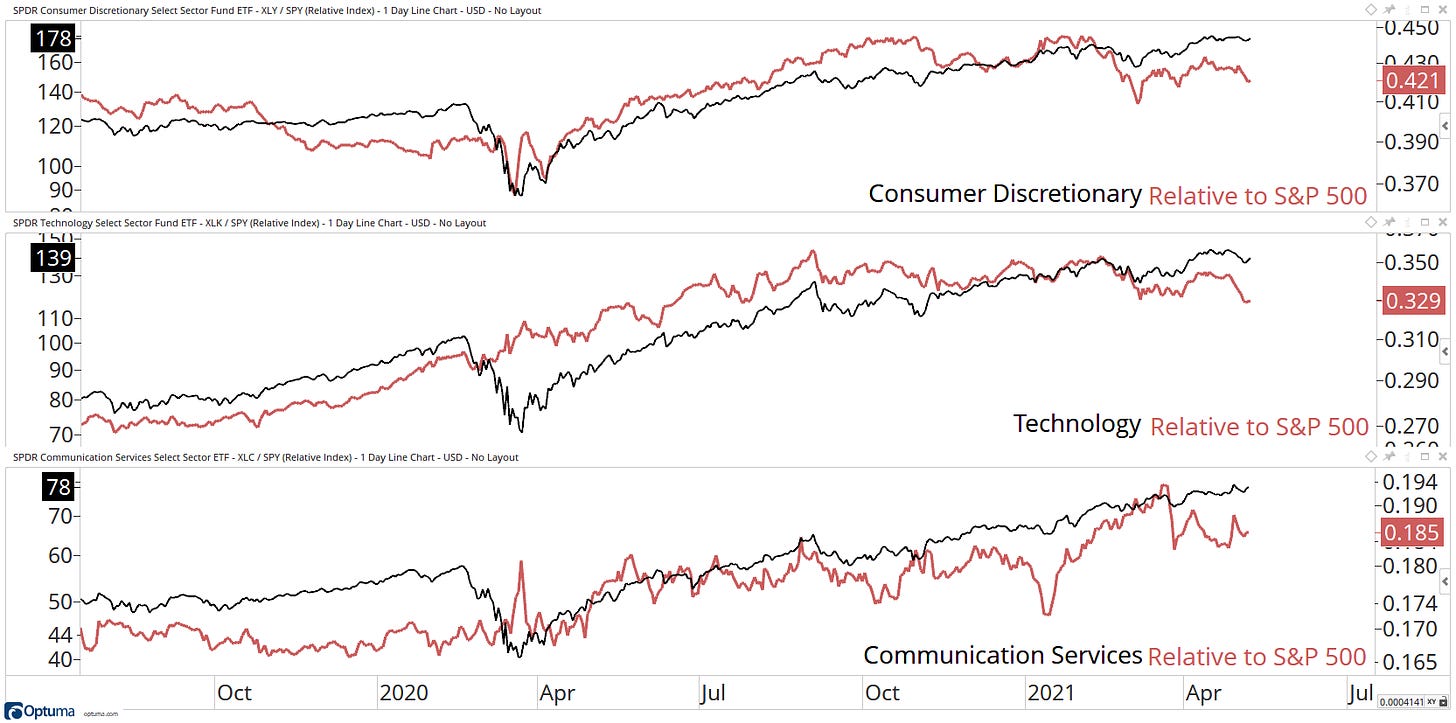
Short-term weakness on an absolute and relative basis is isolated only to these growth / techy areas of the market.
Strength continues within the cyclical areas of the market which suggests a risk-on environment.
Continued relative weakness from the defensive areas of the market.
US Stock Market Breadth
Index:
Breadth reading on the S&P 500 index is looking healthy.
Deterioration continues on the Nasdaq 100 Index.
US Large, Mid and Small-cap Sectors:
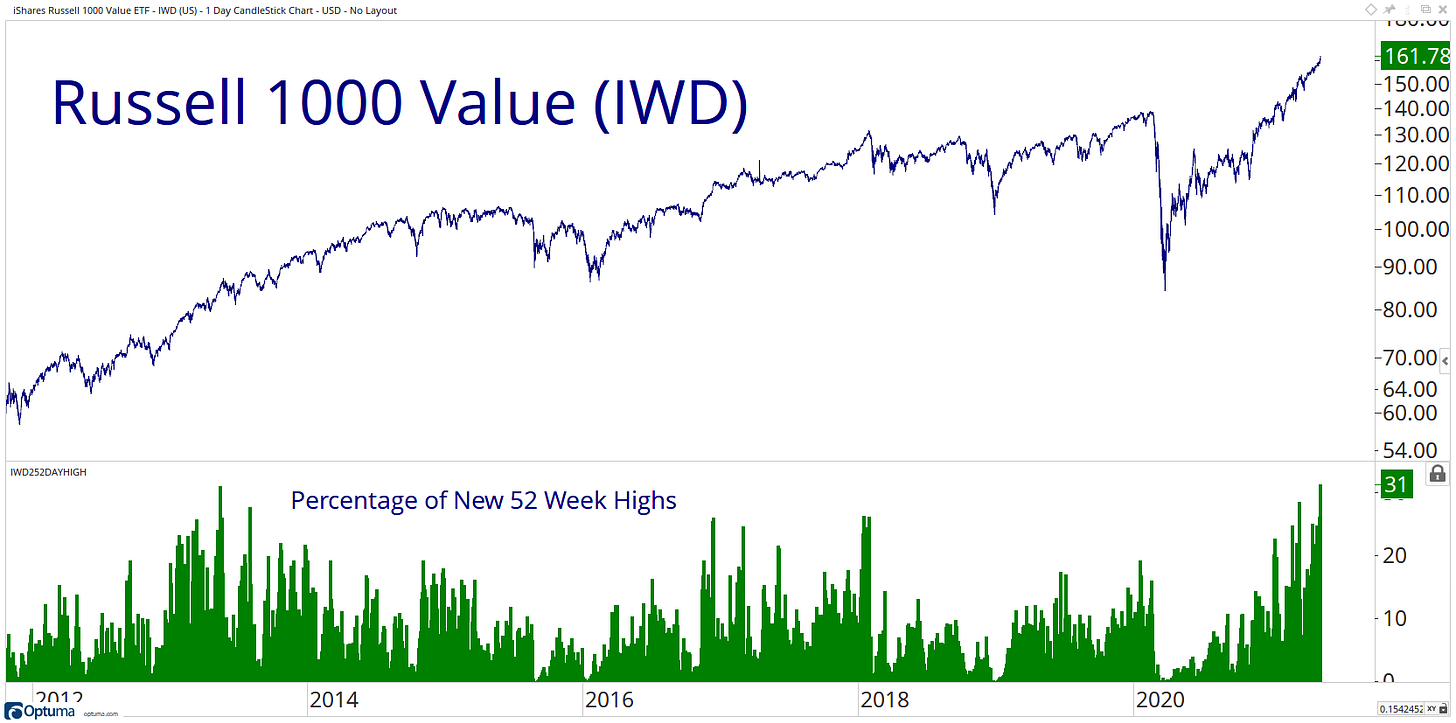
We are seeing breadth expansion within the value area of the market.
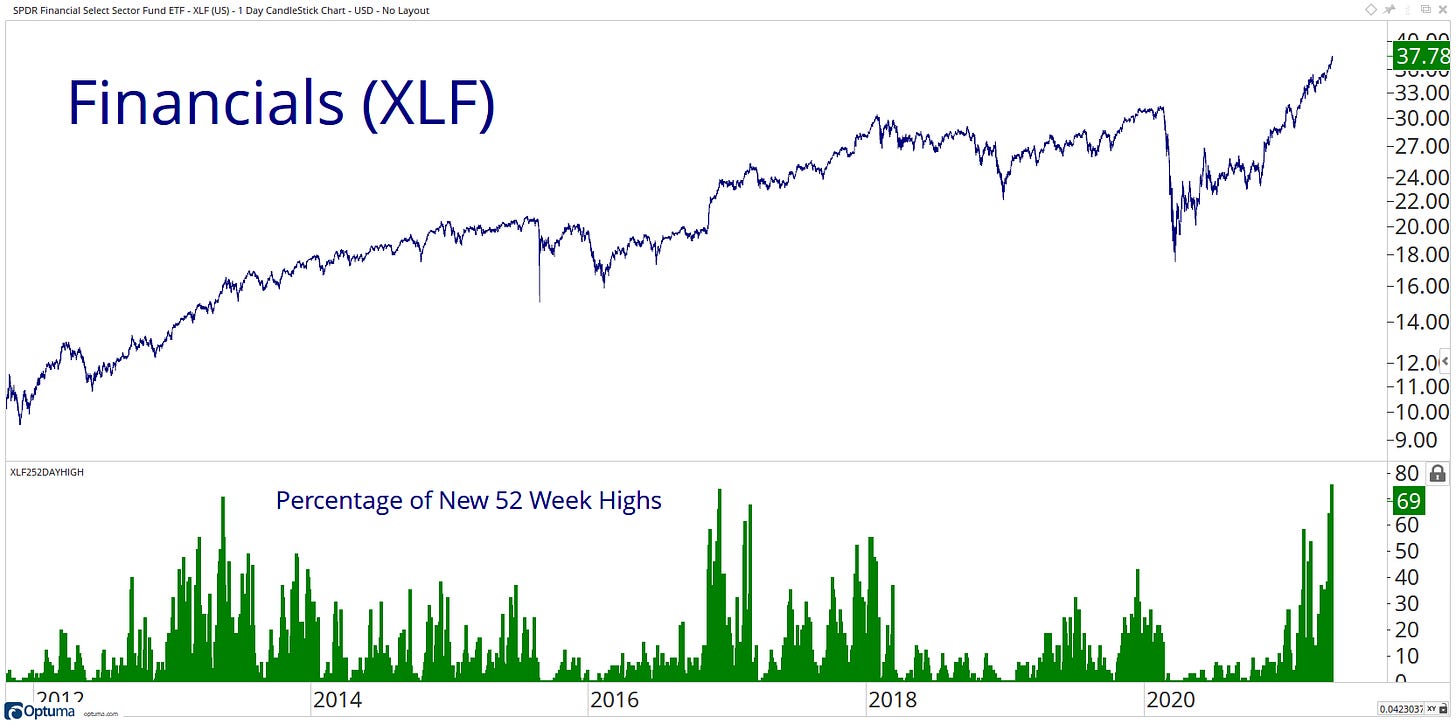
Financials posting up a breadth thrust - Its highest reading in over a decade.
Same story in Materials.
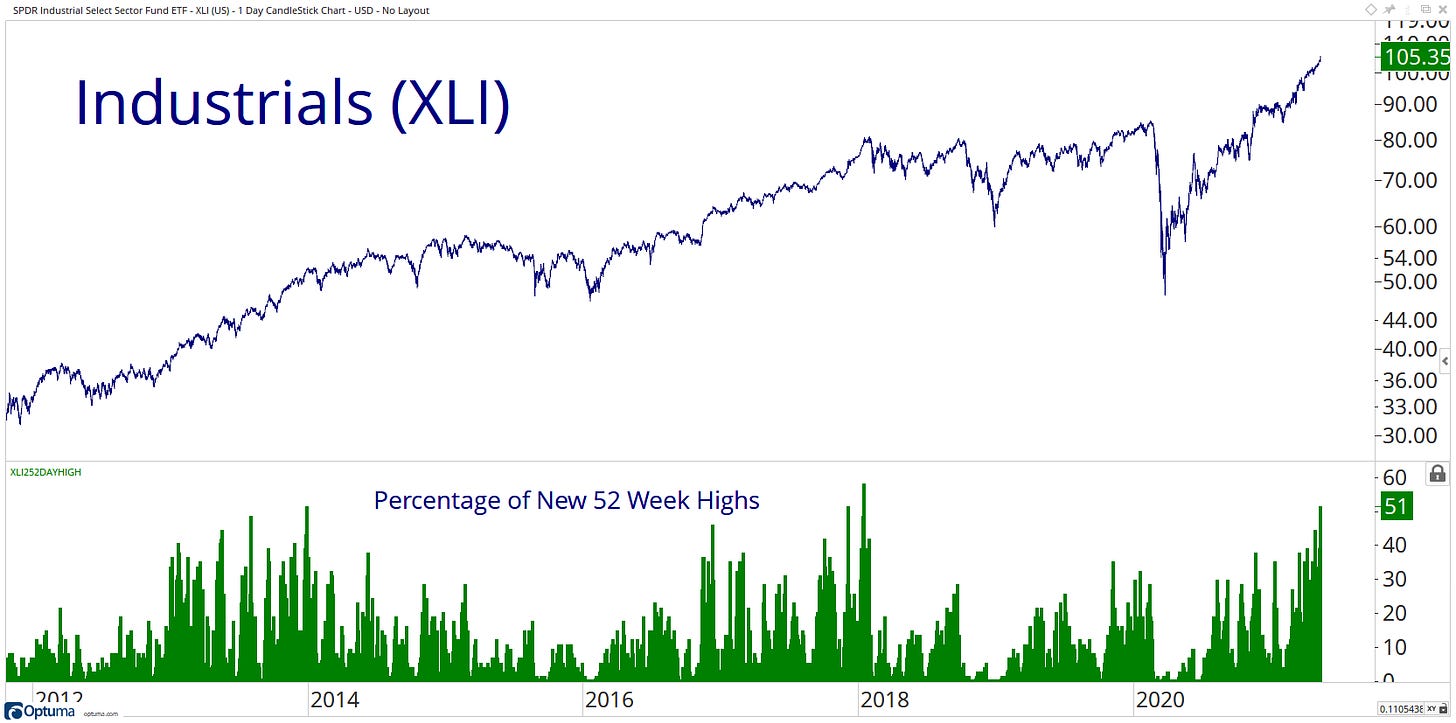
51% of the Industrial sector is at fresh 52-week highs which is its highest level since 2018.
If you enjoyed this post, please consider sharing for more to see!
Stay safe, and good luck out there…
GH
DISCLAIMER: The information included in this report are obtained from sources which Jotting on Charts believes to be reliable, but we do not guarantee its accuracy. All of the information contained herein should be independently verified and confirmed. All opinions expressed by Jotting on Charts are for informational purposes only. Jotting on Charts is not a financial advisor. This does not constitute investment advice, nor any opinions expressed, constitute a solicitation of any securities or related financial instruments' purchase or sale. Jotting on Charts is not responsible for any losses incurred from any use of this information. Do not trade with money you cannot afford to lose. It is recommended that you consult a qualified financial advisor before making any investment decisions.


