Strength and Weakness
A brief note on finding the strong and weak sectors.

Monitoring sectors is a powerful way to get a beat on the themes in the market. Following sector rotation and understanding why it’s happening is a critical input into the investment process.
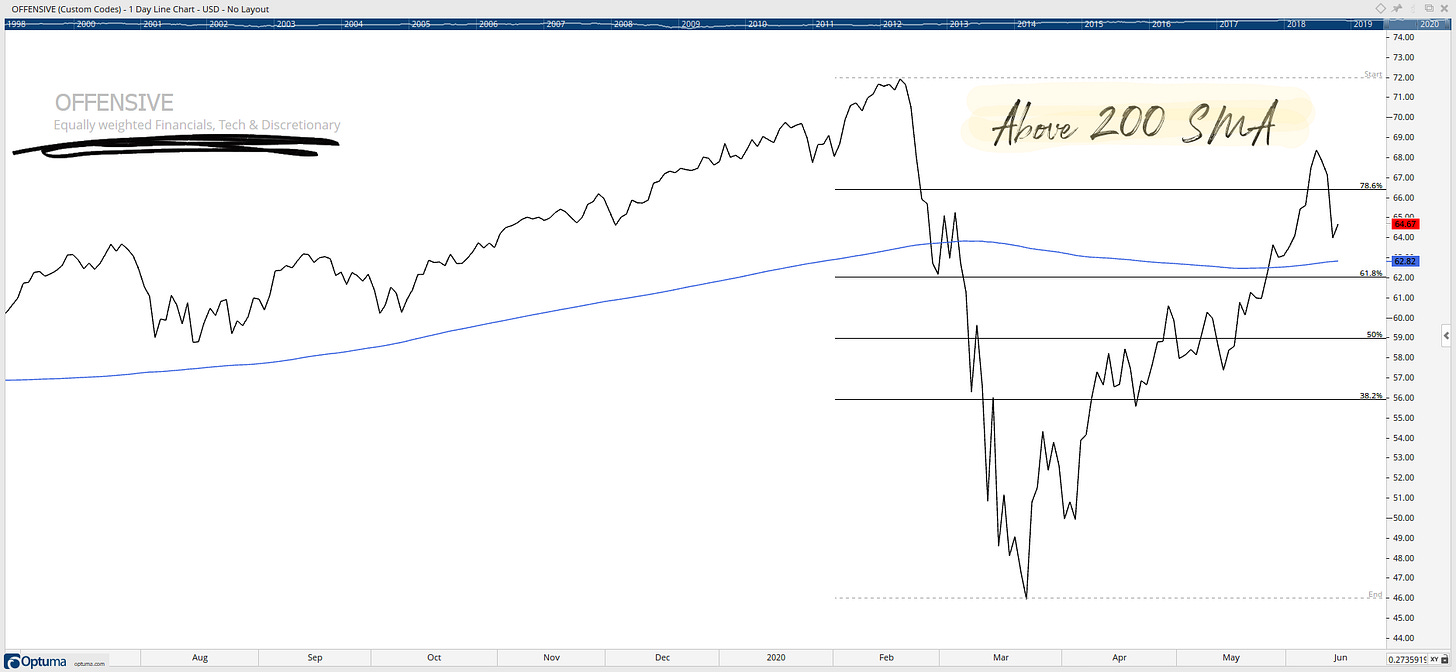
Let us begin with a look at a custom index of my offensive sectors (Financials, Technology and Consumer Discretionary) it has had a strong upwards move since the 2020 March lows, last week it found some resistance at the 78.6% Fibonacci level but hasn’t broken the uptrend. It is also above its slightly rising 200-day simple move average.

When I look at offensive sectors performance from the 2020 March lows, Consumer Discretionary has been the clear leader in the custom index — up 44.56% since the market bottomed in March.
XLY: +44.56%
XLK: +42.57%
XLF: +36.81%

Now for a custom index of the defensive sectors (Consumer Staples, Utilities and Health Care), It had a more substantial move upwards early than the offensive index. However, it has been trading sideways for the past 2.5 months. It is below its flat 200-day simple move average.

When I look at defensive sectors performance from the 2020 March lows, Consumer Staples have been the clear lagger in the custom index — up 20.89% since the market bottomed in March.
XLU: +31.47%
XLV: +31.09%
XLP: +20.89%

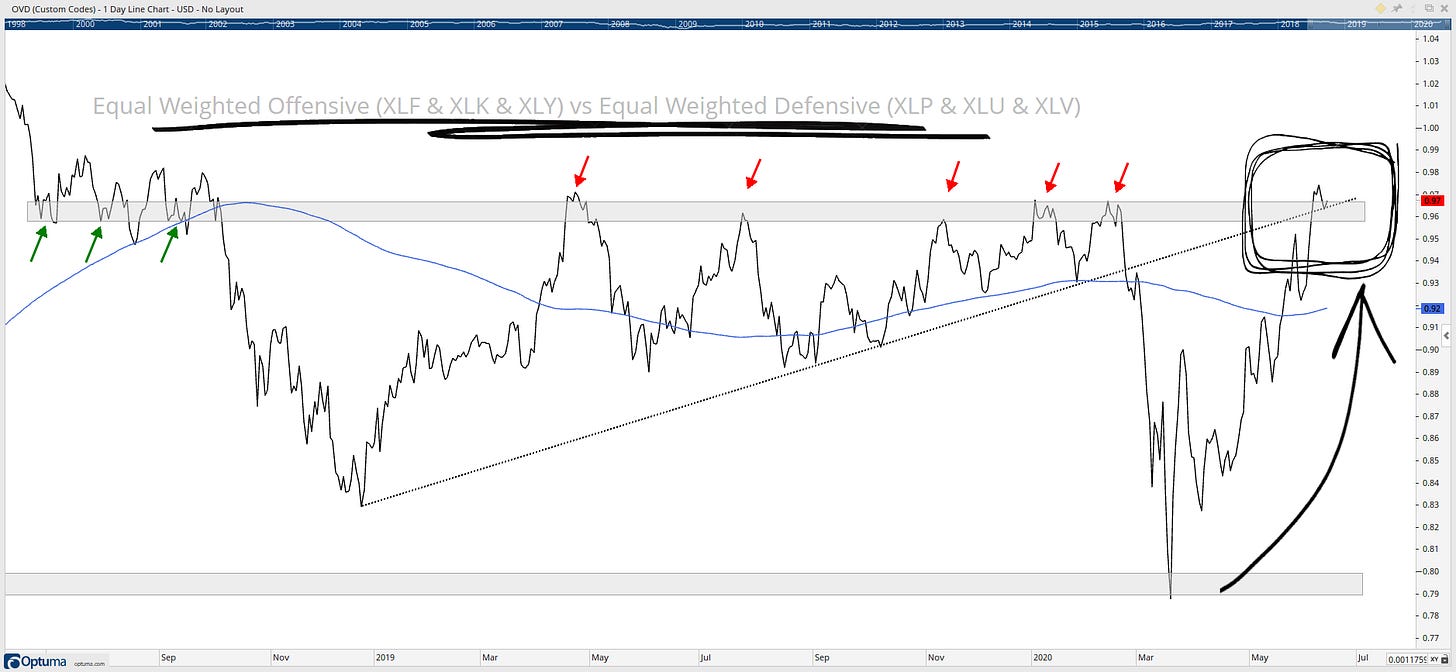
I always like to dig a little deeper, So here is a relative strength chart showing the basket of the offensive sectors (Financials, Technology and Consumer Discretionary) versus the basket of the defensive sectors (Consumer Staples, Utilities and Health Care). When the line is rising, it means offensive sectors are outperforming defensive sectors and vice versa. This ratio gives me a good indication of risk appetite among the market. I would like to point out this ratio has tested and held above the critical support level, which dates back to 2008. Since then, this ratio is supporting the bull case for the market with a move straight back to prior resistance.

The point of using relative strength analysis is to help understand which areas are showing superior performance. The second purpose is to avoid investments in the regions that are showing relatively weak performance. Relative strength analysis is the best way to compare any two entities to measure their relative performance. Lets now take the leading sector and put it against the weakest sector!
For me, this is one of the most informative ratios that I look at - Consumer Discretionary vs Consumer Staples… This ratio is a vital risk-on/risk-off indicator for the market. Bulls want to see the more aggressive Consumer Discretionary stocks outperforming the safer Consumer Staples stocks.
As you can see below, Consumer Discretionary has made a substantial breakout of a 24-month downwards trend line in early May and has continued its march onwards nearly to its 2018 all-time high.
The right sector has been leading this market higher.

Let us now look at these sectors separately. Consumer Discretionary is currently testing its recently broken level of resistance as support now. Will we see a breakout of resistance relative to the S&P500? RSI holding bullish ranges and the 200-day simple moving average looks to be starting to slope upwards.

Consumer Staples is below its downwards sloping 200-day simple moving average and the past two months have seen a sharp underperformance relative to the S&P500. The $57 price area is going to be very important going forward, will it hold or break?

Lets us now go to the stock level of the leading sector (XLY) and target the leaders:
AMZN +39.23% YTD performance
HD +11.93% YTD performance
Side note, here is the laggers of XLY:
MCD -2.87% YTD performance
F -28.92% YTD performance

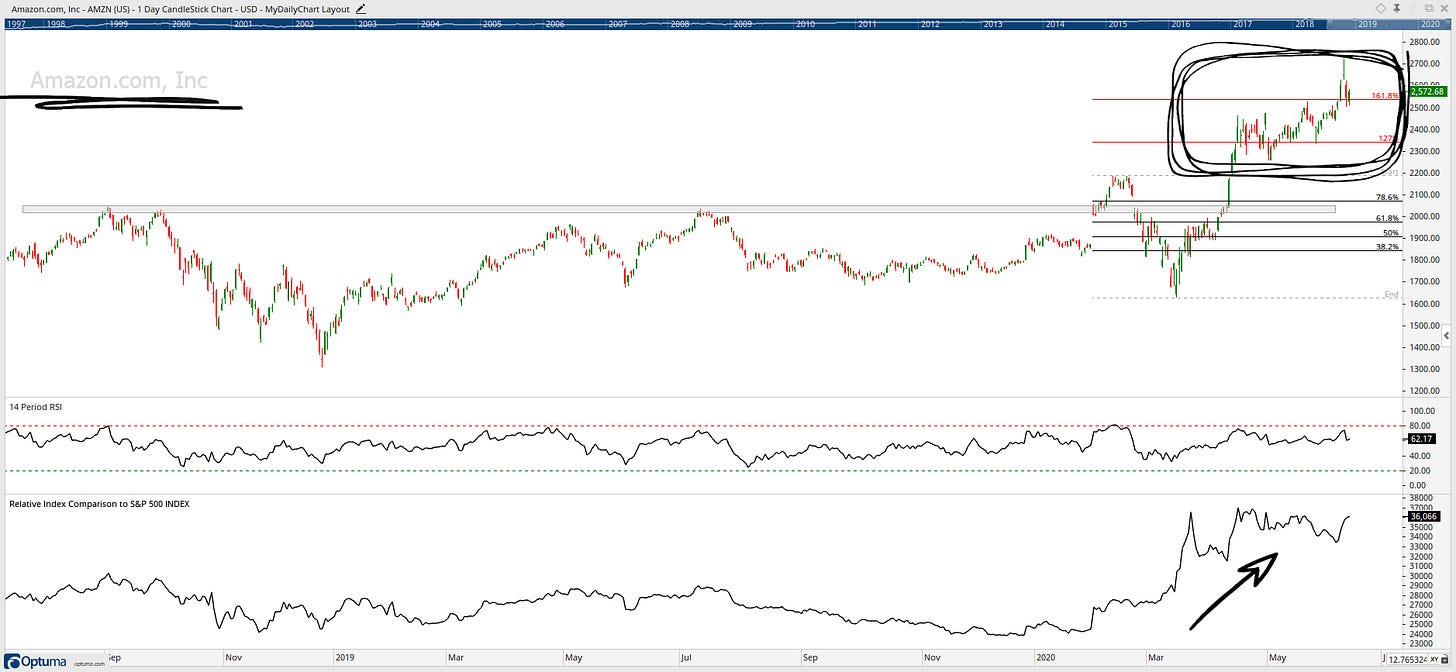
Amazon had a breakout in April of its resistance level which dating back to August 2018 and now has continued its momentum to its 161.8% Fibonacci level. RSI is in healthy bullish ranges and clear outperformance relative to the S&P500. What will stop this powerhouse stock from advancing further?

Home Depot is currently testing its recently broken level of resistance as support now. With bullish momentum in the RSI and also a breakout of resistance relative to the S&P500. What will stop Home Depot from advancing further?

Bottom line: There is always a bull and a bear market at the same time you just need to analyse the market and find the leaders within the bull market.
Stay safe and good luck out there…
GH
P.S. All charts in this post are at EOD 15/06/2020
DISCLAIMER: The information included in this report are obtained from sources which Jotting on Charts believes to be reliable, but we do not guarantee its accuracy. All of the information contained herein should be independently verified and confirmed. Jotting on Charts is not a financial advisor, and this does not constitute investment advice nor any opinions expressed, constitute a solicitation of the purchase or sale of any securities or related financial instruments. Jotting on Charts is not responsible for any losses incurred from any use of this information. Do not trade with money you cannot afford to lose. It is recommended that you consult a qualified financial advisor before making any investment decisions.


Nice breakdown. Market seems to be at a critical point right now. I love your tech analysis arguments because I’m very much a visual person. But right now the fundamentals may start to to create some headwinds for the market. Which I think will be healthy but no guarantees with the Fed put still strong.