Its been over a month since we last looked at the 30 largest stocks in the S&P 500 by market cap.
In this post, I like to keep my commentary short and sweet and let the charts do the talking! I like to call it the ‘keep it simple, stupid’ approach!
Let’s begin!….
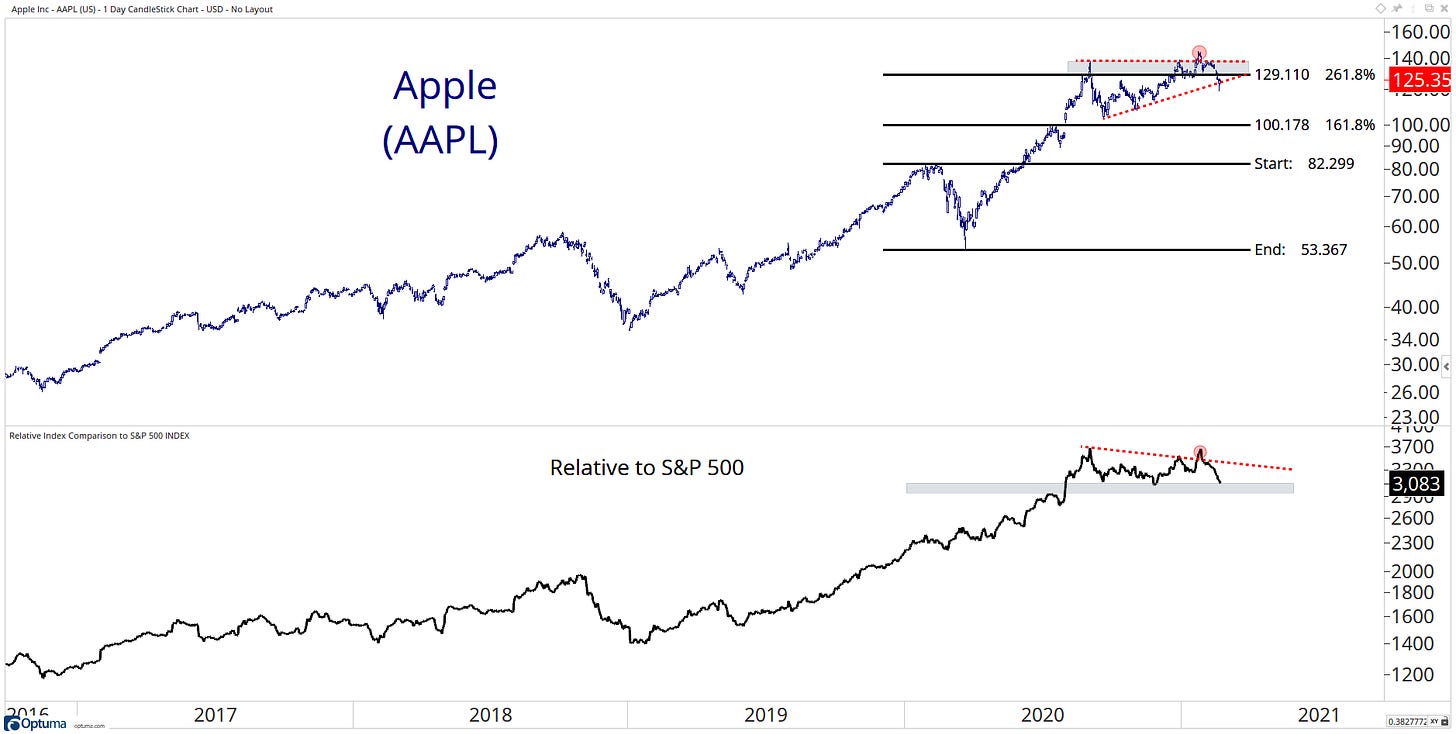
Apple (AAPL) Technology
Apple is flirting with a breakdown of the ascending triangle pattern, which could see a move back to the 161.8 fib level.
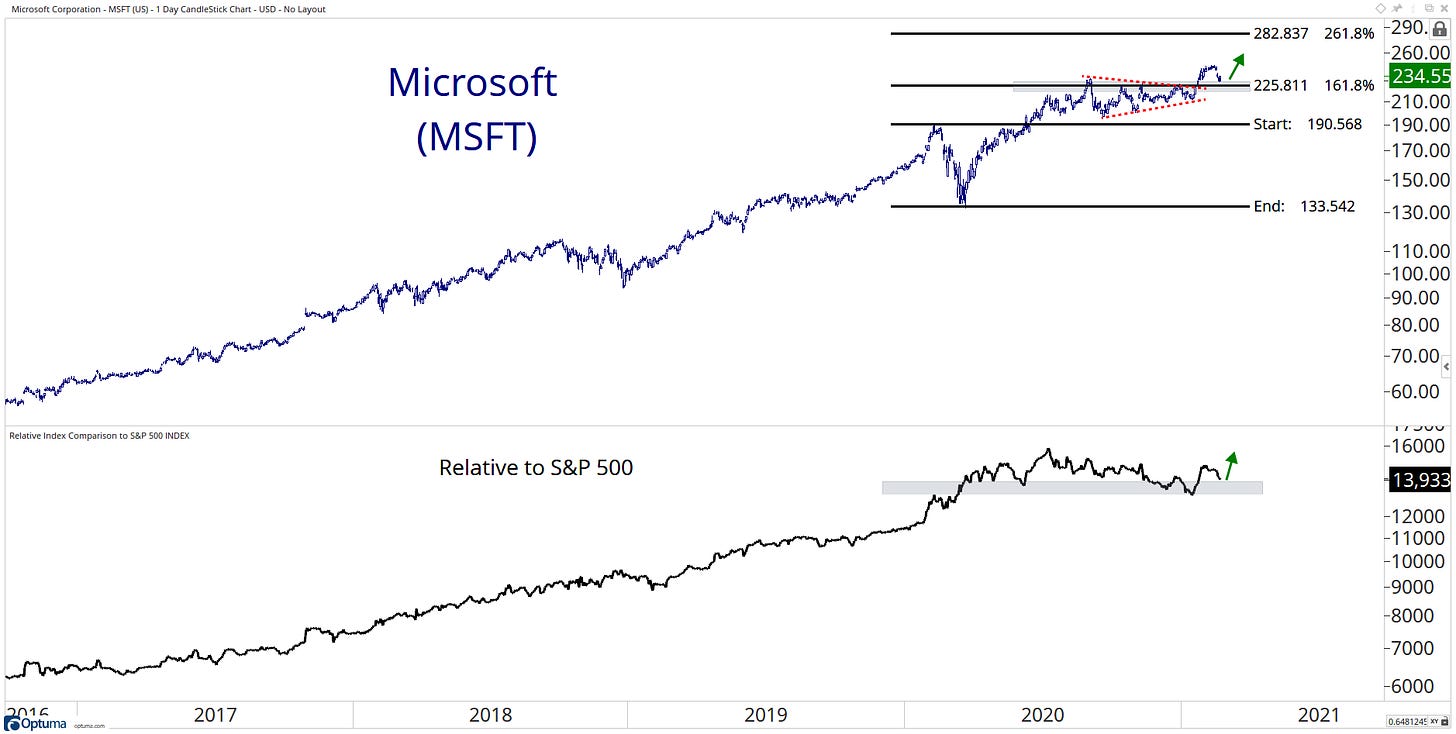
Microsoft Corporation (MSFT) Technology
Can MSFT hold above this current level of resistance?!
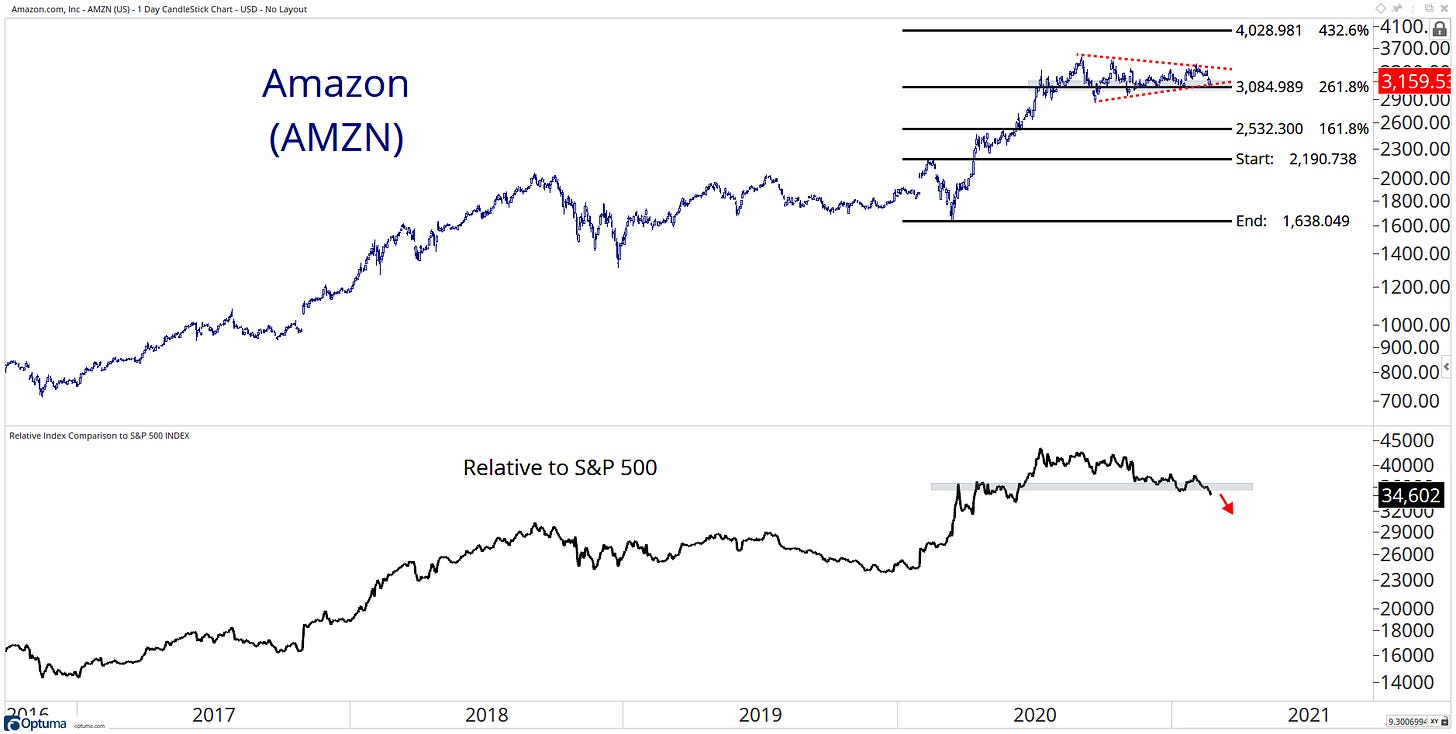
Amazon.com (AMZN) Consumer Cyclical
AMZN is still holding key levels, but it’s on the ropes after a few months of doing nothing!
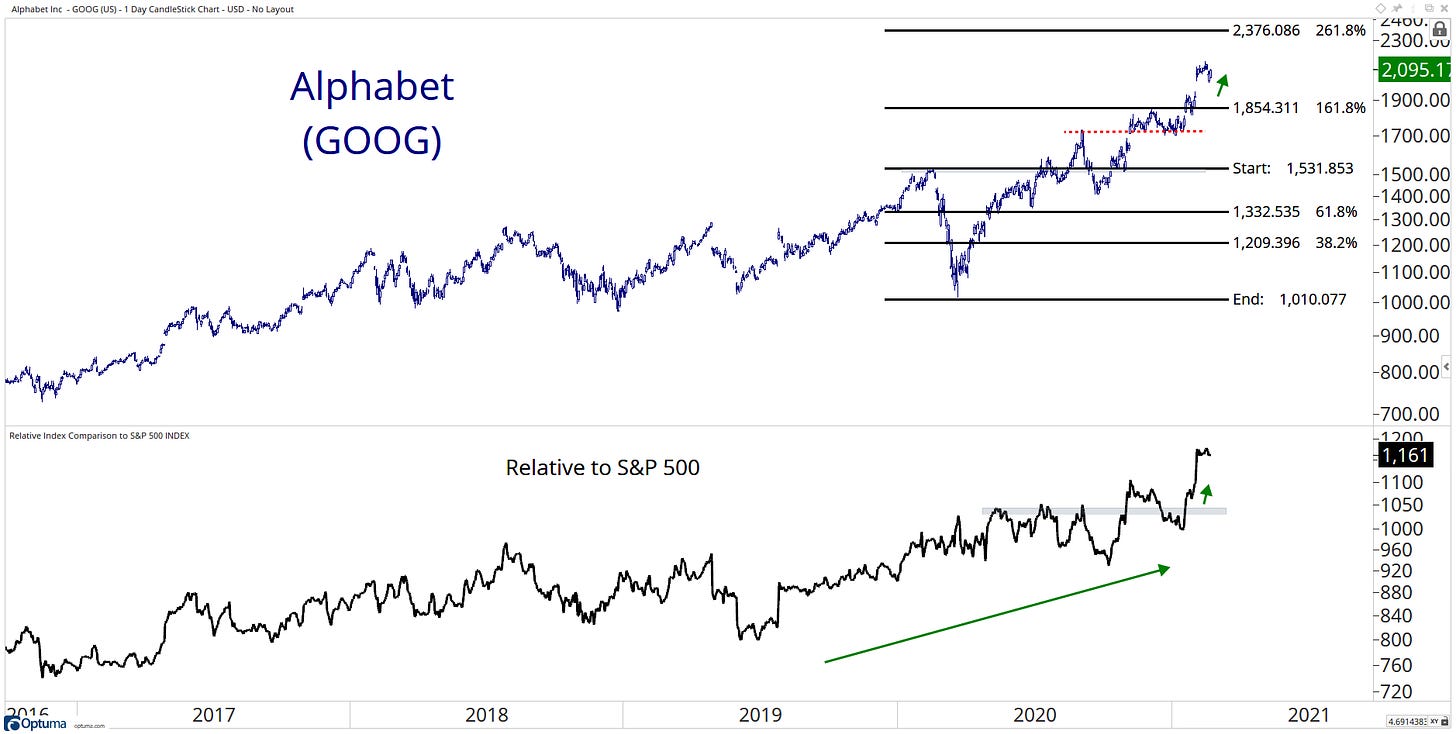
Alphabet (GOOG) Communication Services
The uptrend is continuing nicely on both an absolute and relative basis.
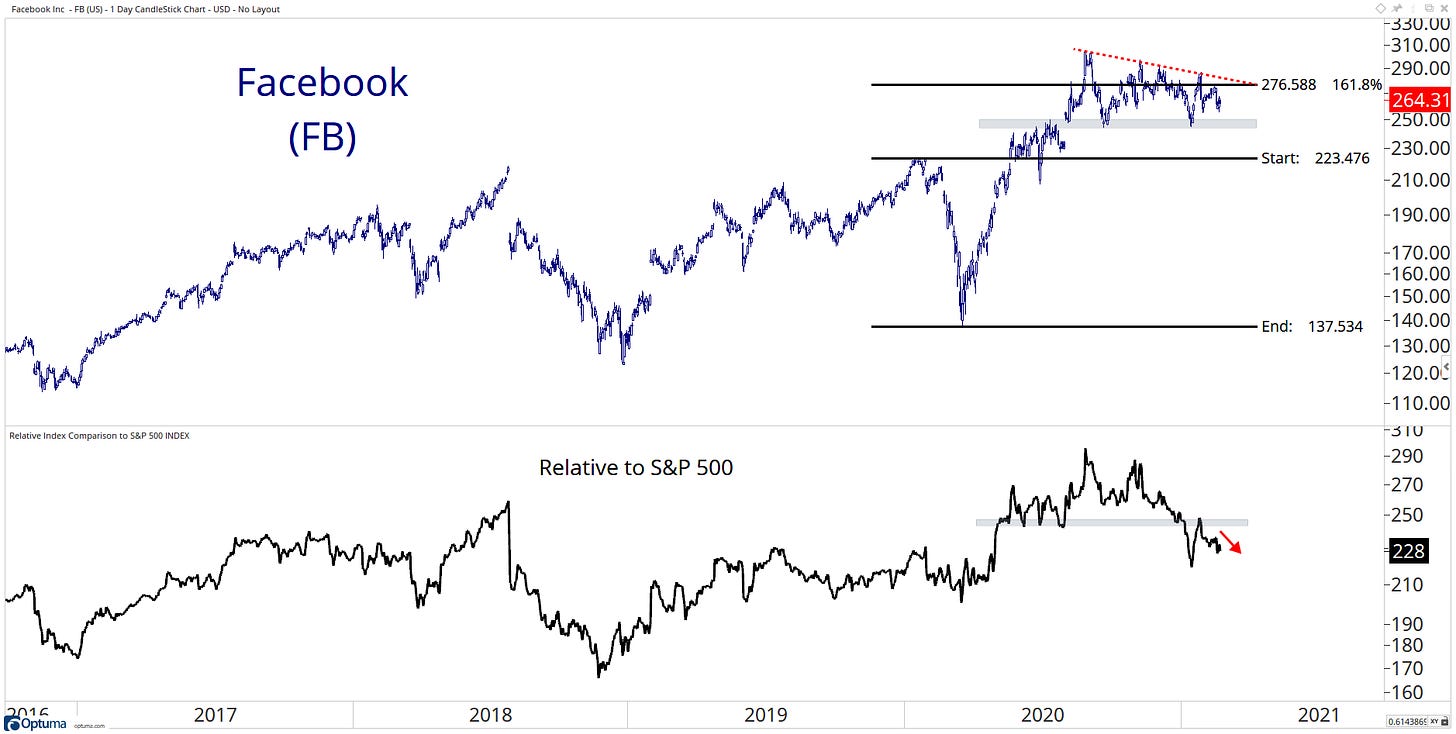
Facebook (FB) Communication Services
FB is stuck under a significant level of resistance.
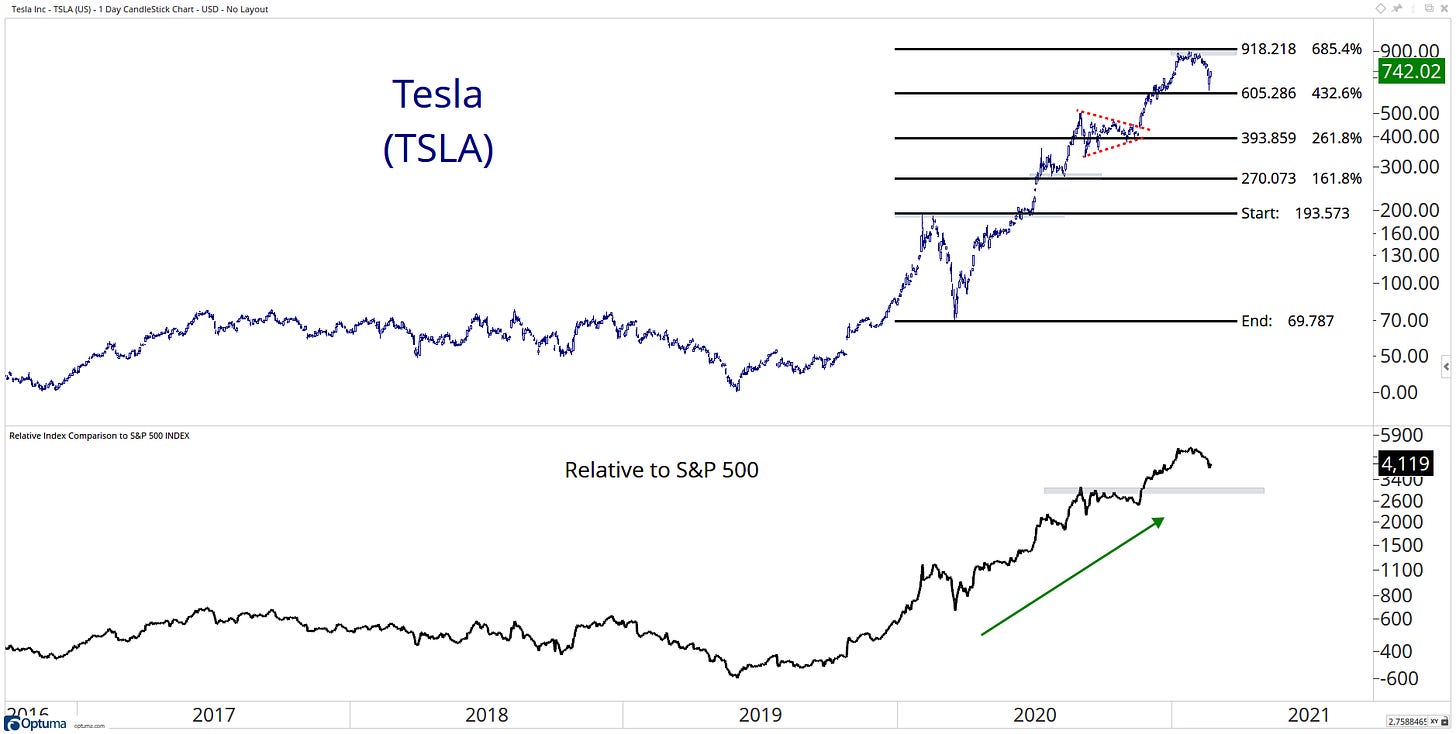
Tesla (TSLA) Consumer Cyclical
Fading with some strong momentum to the downside after testing out the 685.4 level. However, its uptrends on both an absolute and relative basis have not yet been violated…
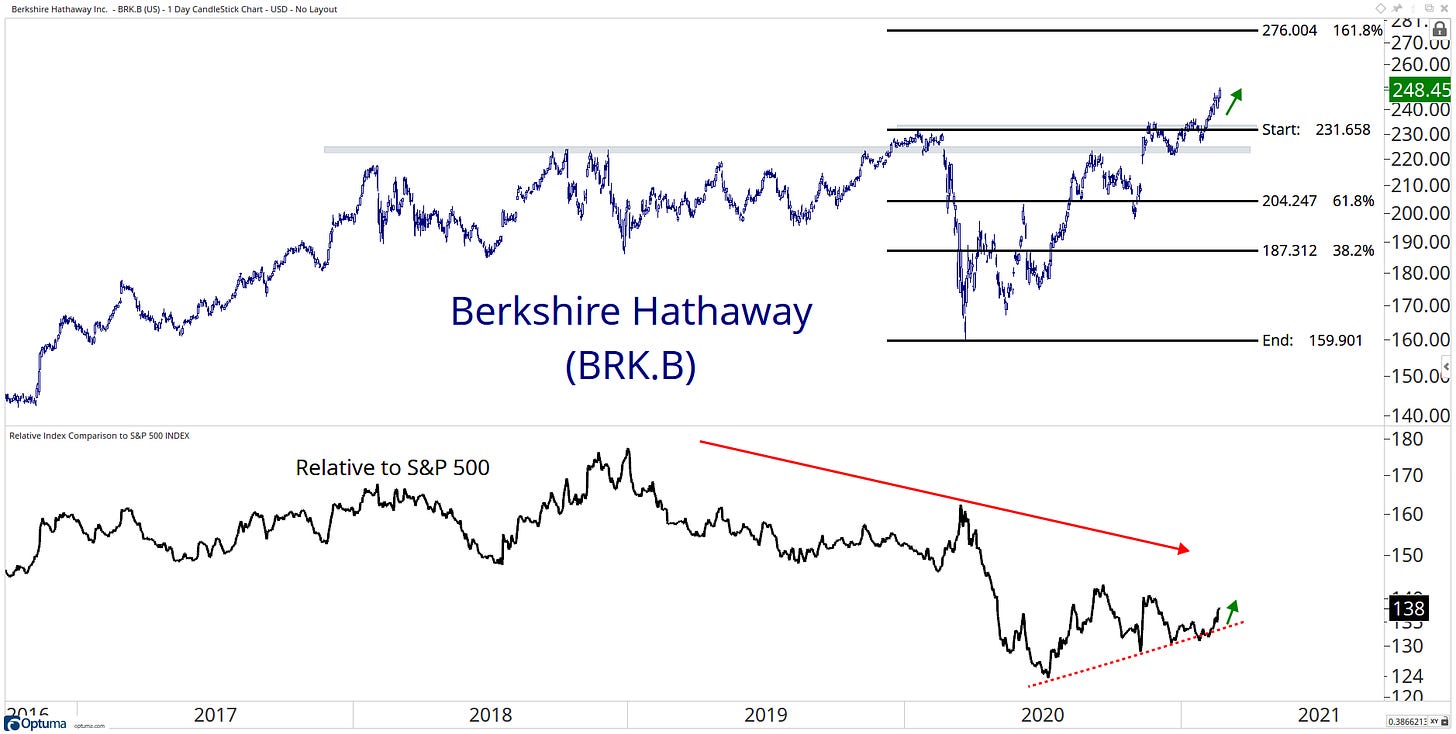
Berkshire Hathaway (BRK.B) Financial
Breaking out to new all-time highs!
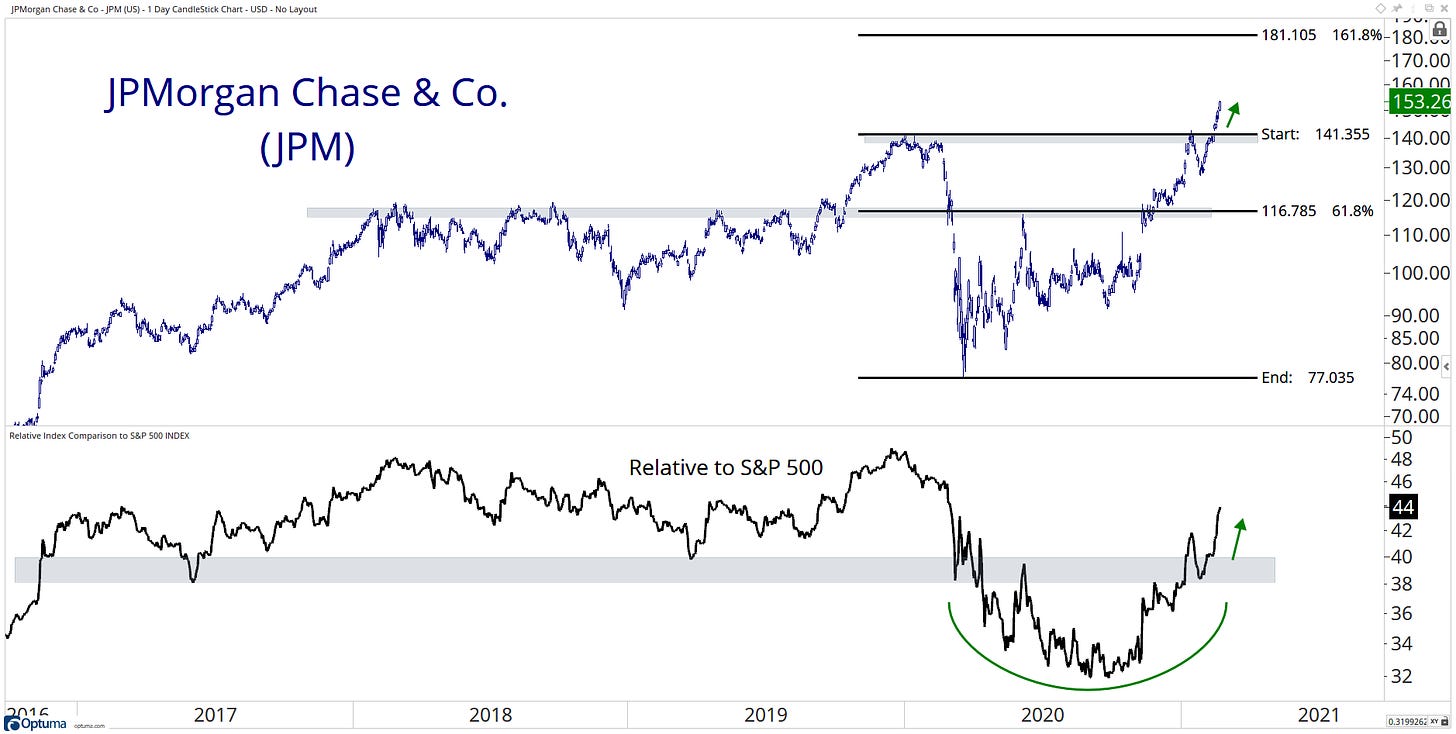
JPMorgan Chase & Co. (JPM) Financial
Another stock within the Financial sector is breaking out to new all-time highs.
Visa (V) Financial
And another one!
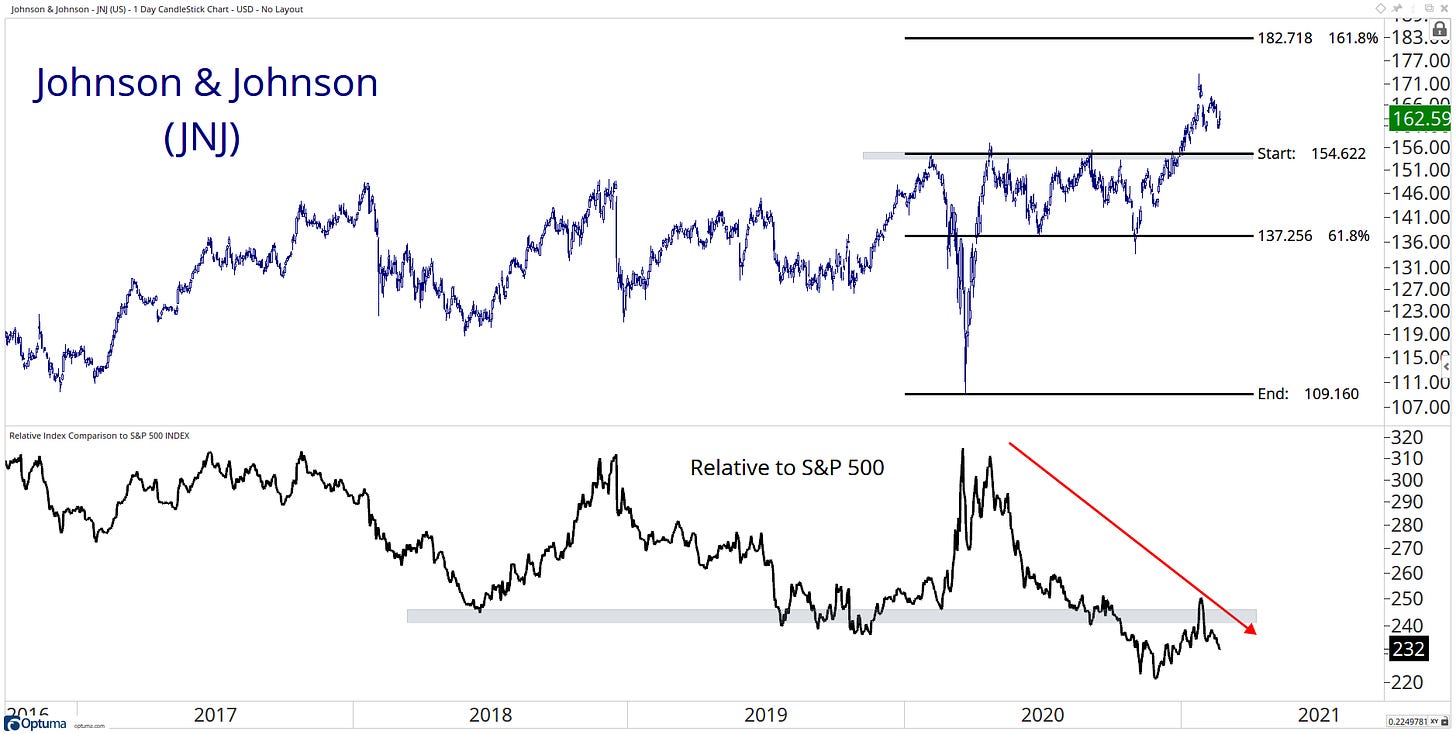
Johnson & Johnson (JNJ) Healthcare
Up near highs…. but its relative strength vs the broader market needs some work!
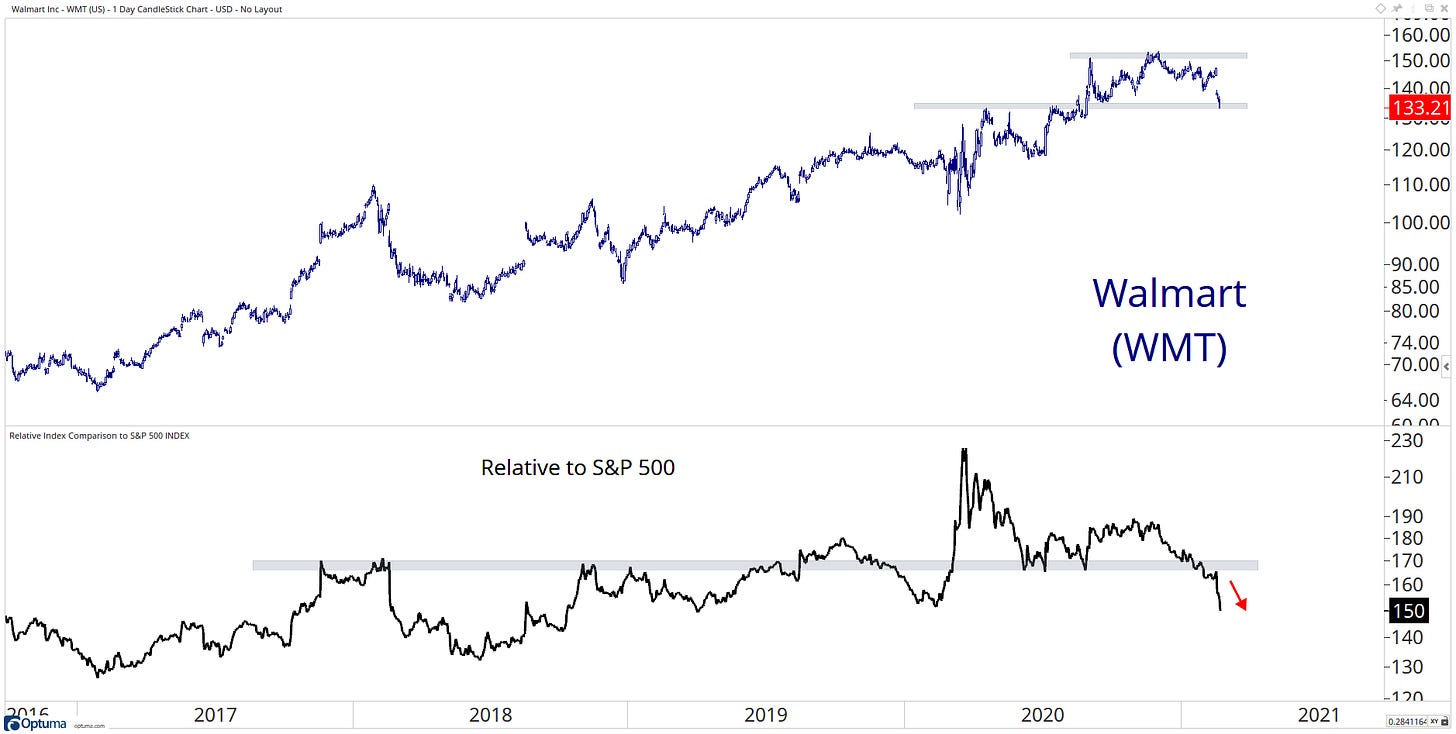
Walmart (WMT) Consumer Defensive
It continues to be stuck within a range near its highs. 133 looking like its a critical level to be watching here.
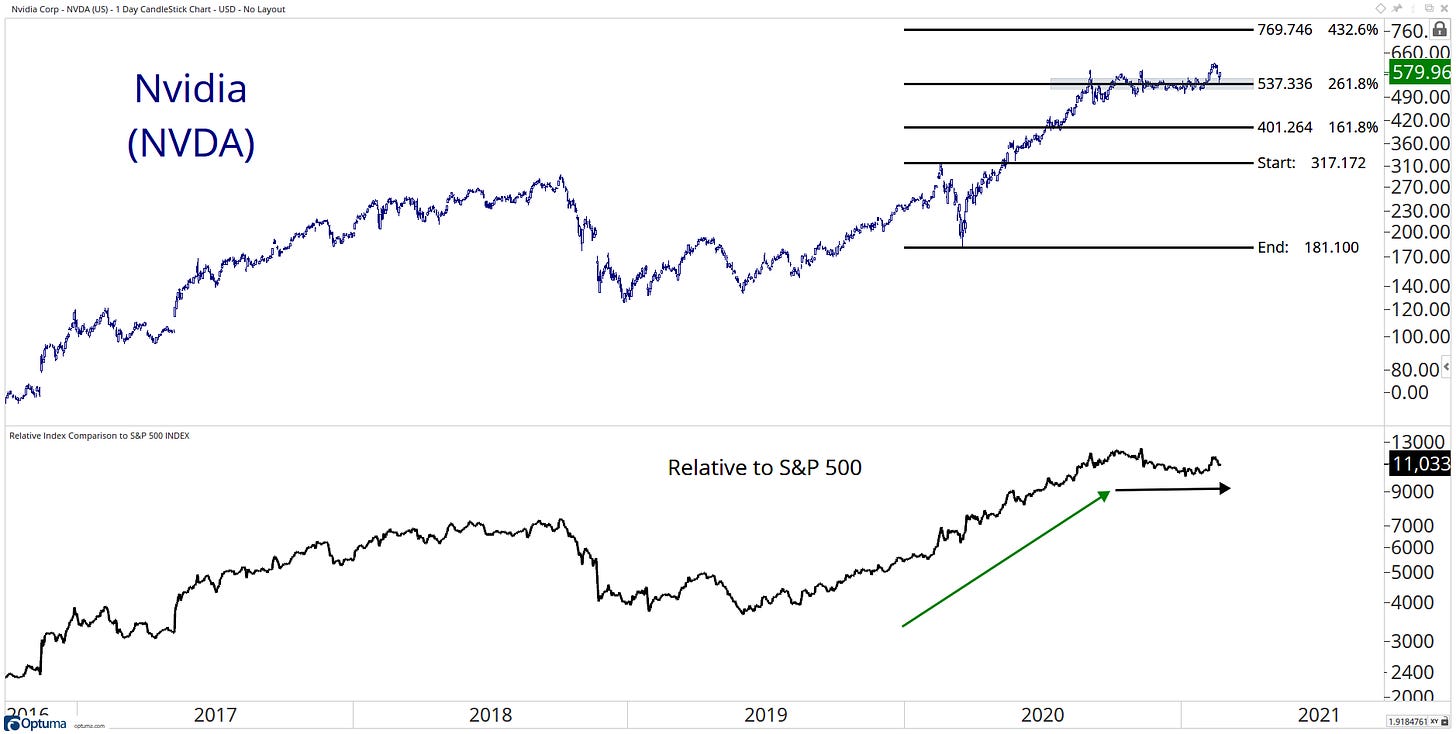
Nvidia Corp (NVDA) Technology
Nvidia is asleep at current levels.
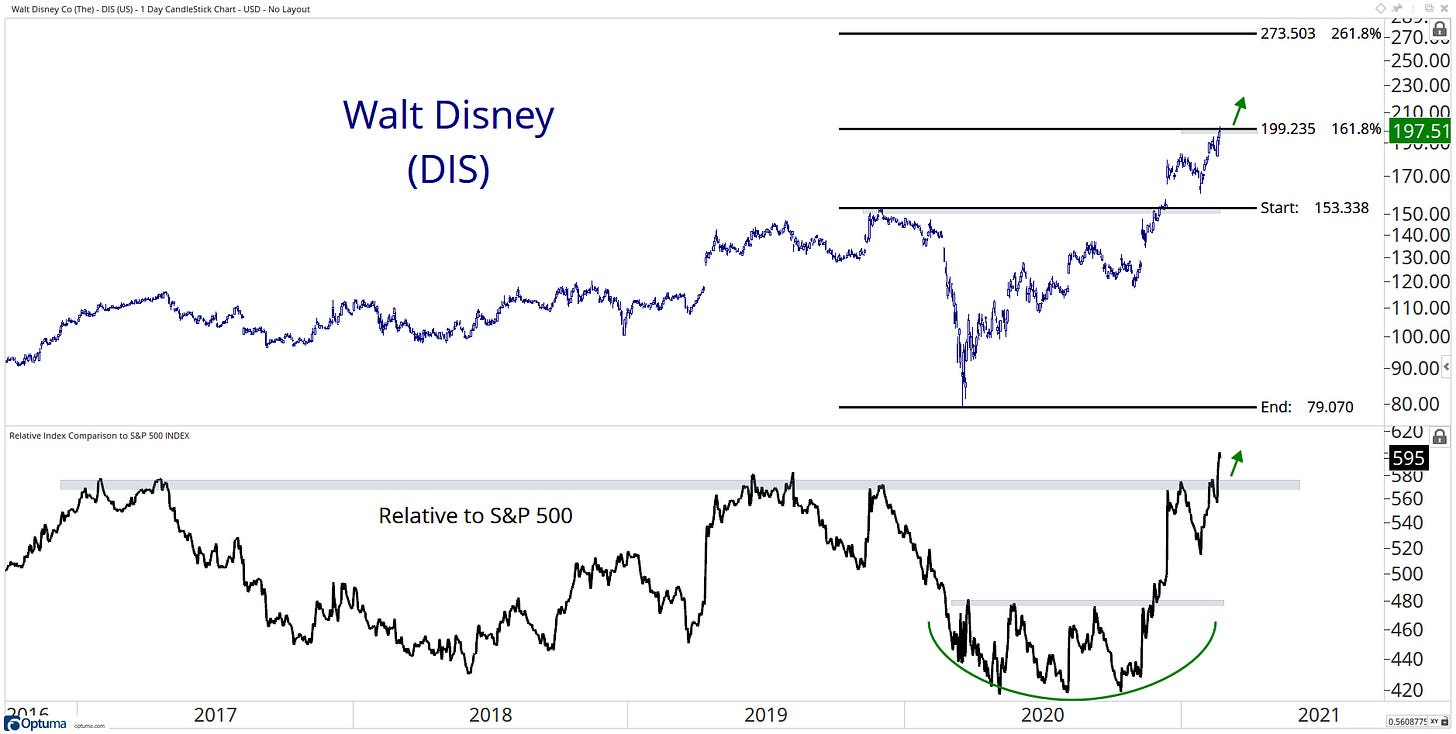
Walt Disney Co. (DIS) Communication Services
Disney is starting to get some strong momentum here. All-time highs on both an absolute and relative basis!
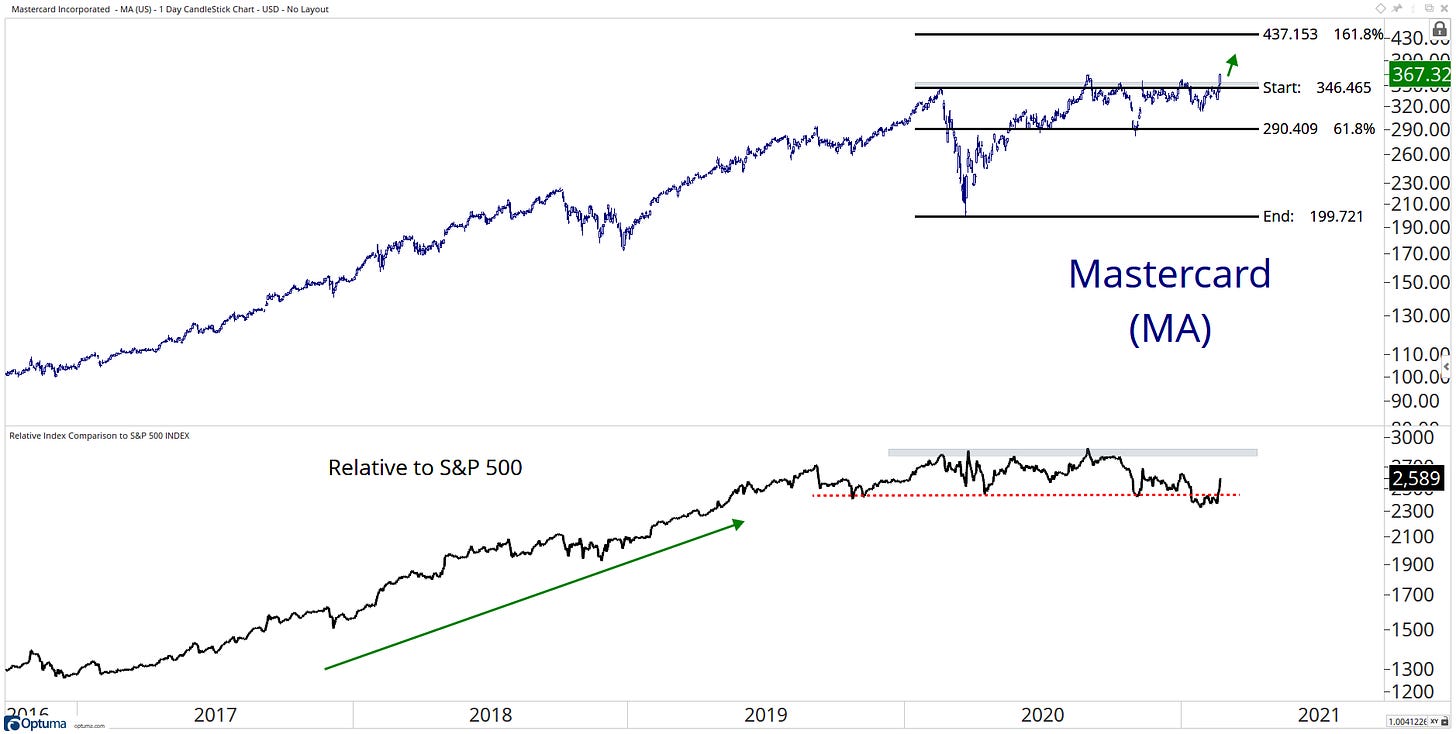
Mastercard (MA) Financial
All-time highs with a breakout above a key level of resistance…
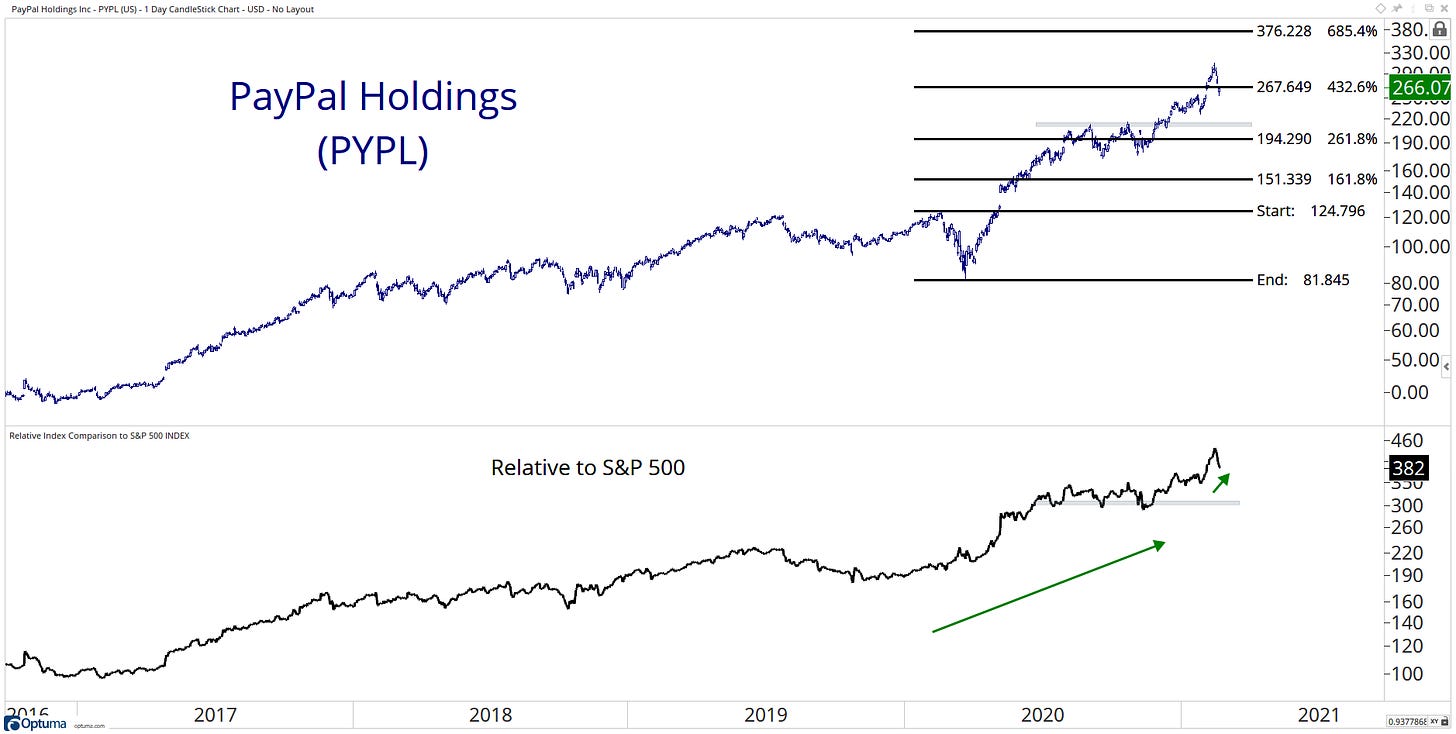
PayPal Holdings (PYPL) Financial
Fading to the downside after testing out the 432.6 level. However, its uptrends on both an absolute and relative basis have not yet been violated…
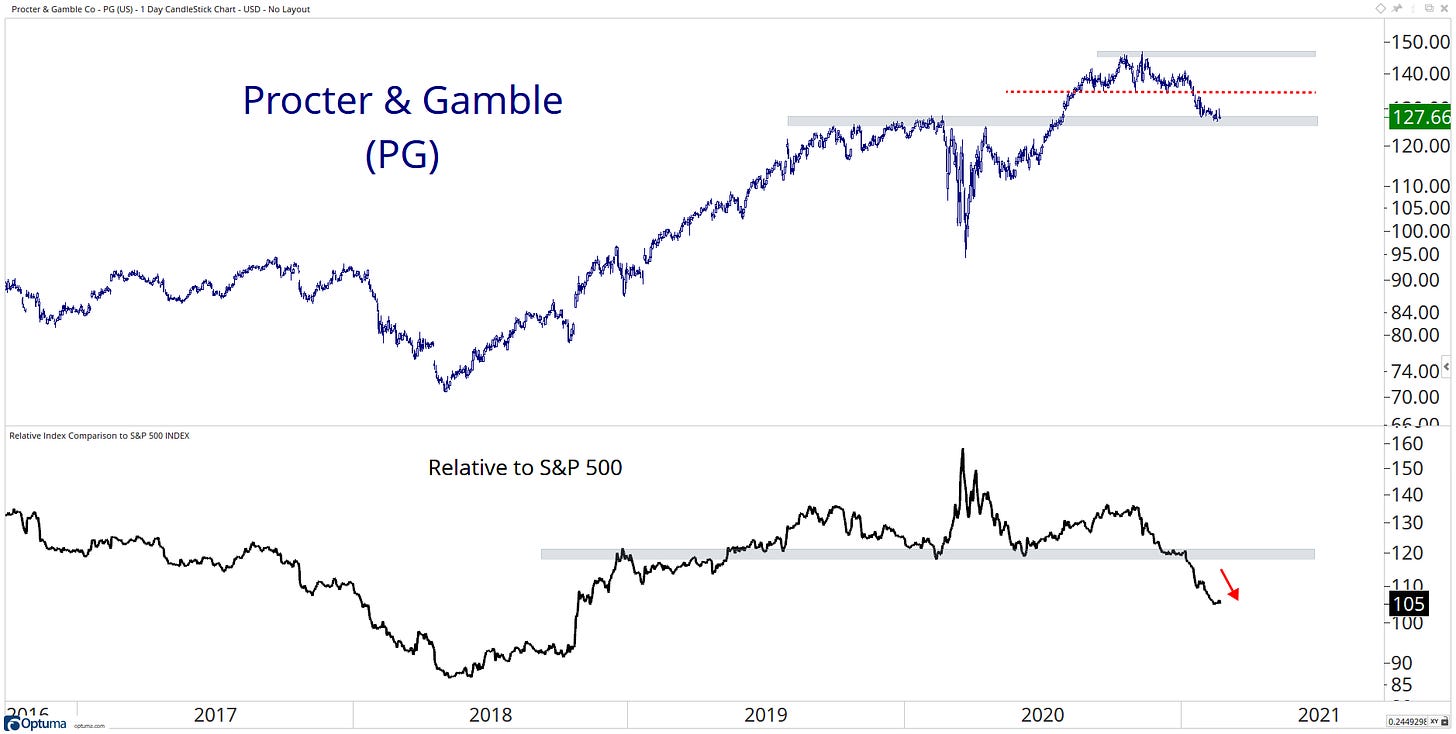
Procter & Gamble Co. (PG) Consumer Defensive
It continues to be within a range here and looks like its currently testings its support level.
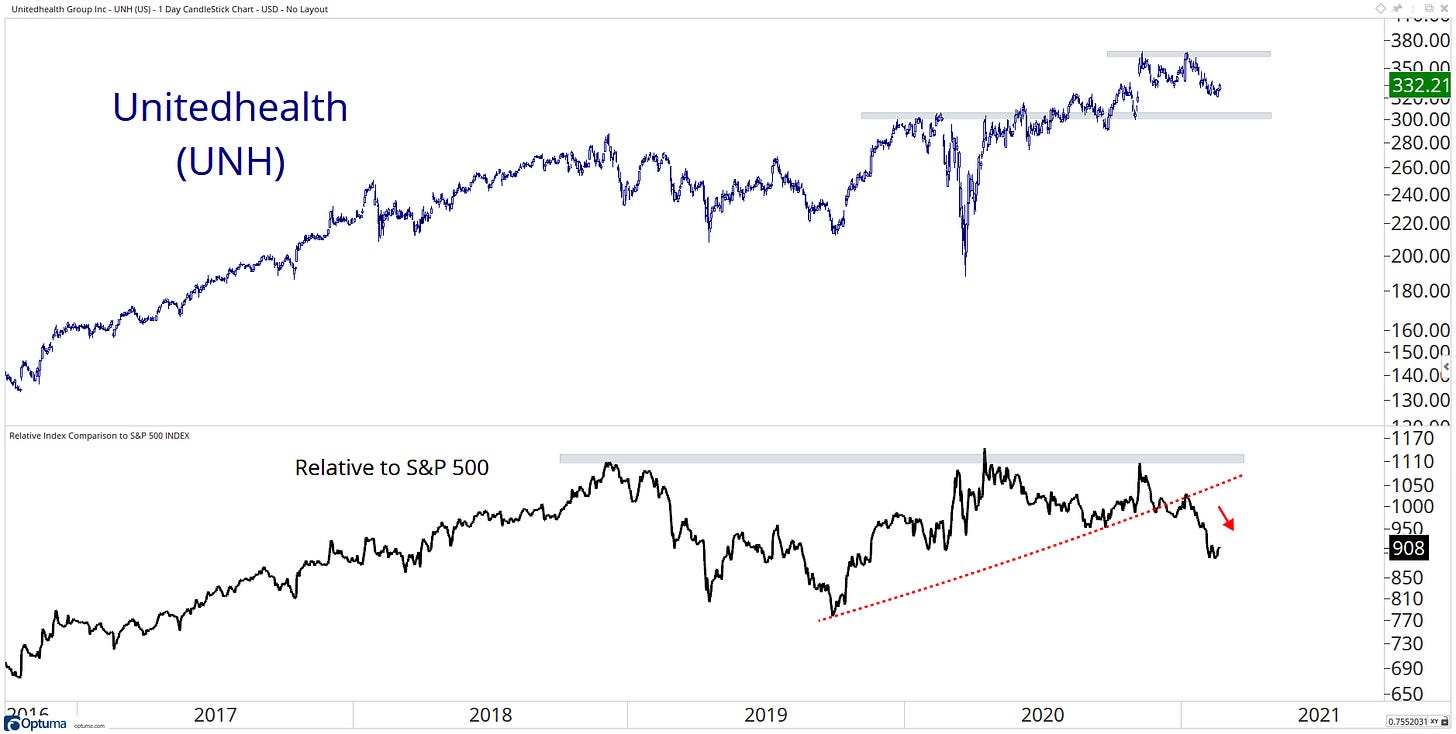
Unitedhealth Group (UNH) Healthcare
It looks to be stuck within a range near all-time high levels. Breaking down on a relative basis is not a good look.
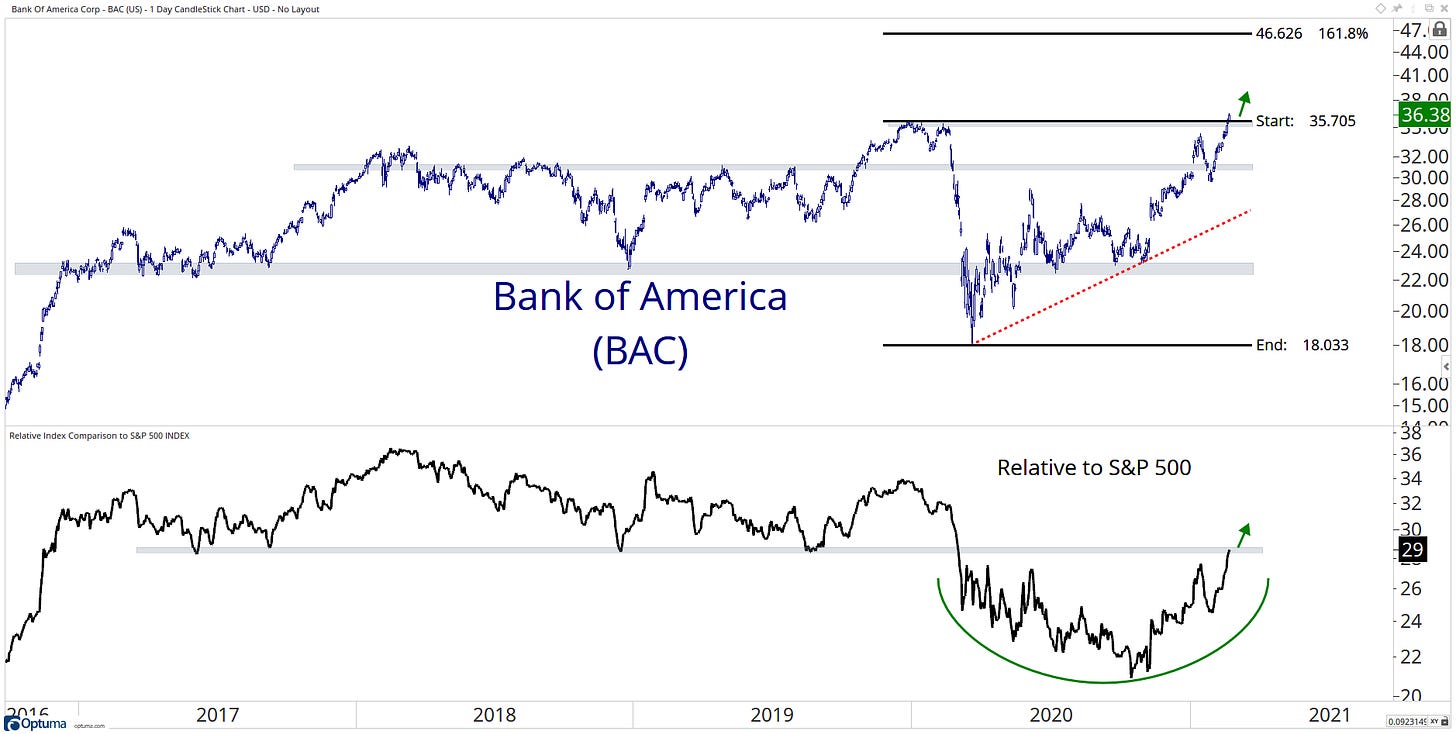
Bank Of America Corp. (BAC) Financial
Breaking out above its 2020 highs is a massive development for BAC and the financial sector!
Home Depot (HD) Consumer Cyclical
The descending triangle pattern looks to be in the early stages of a breakdown.
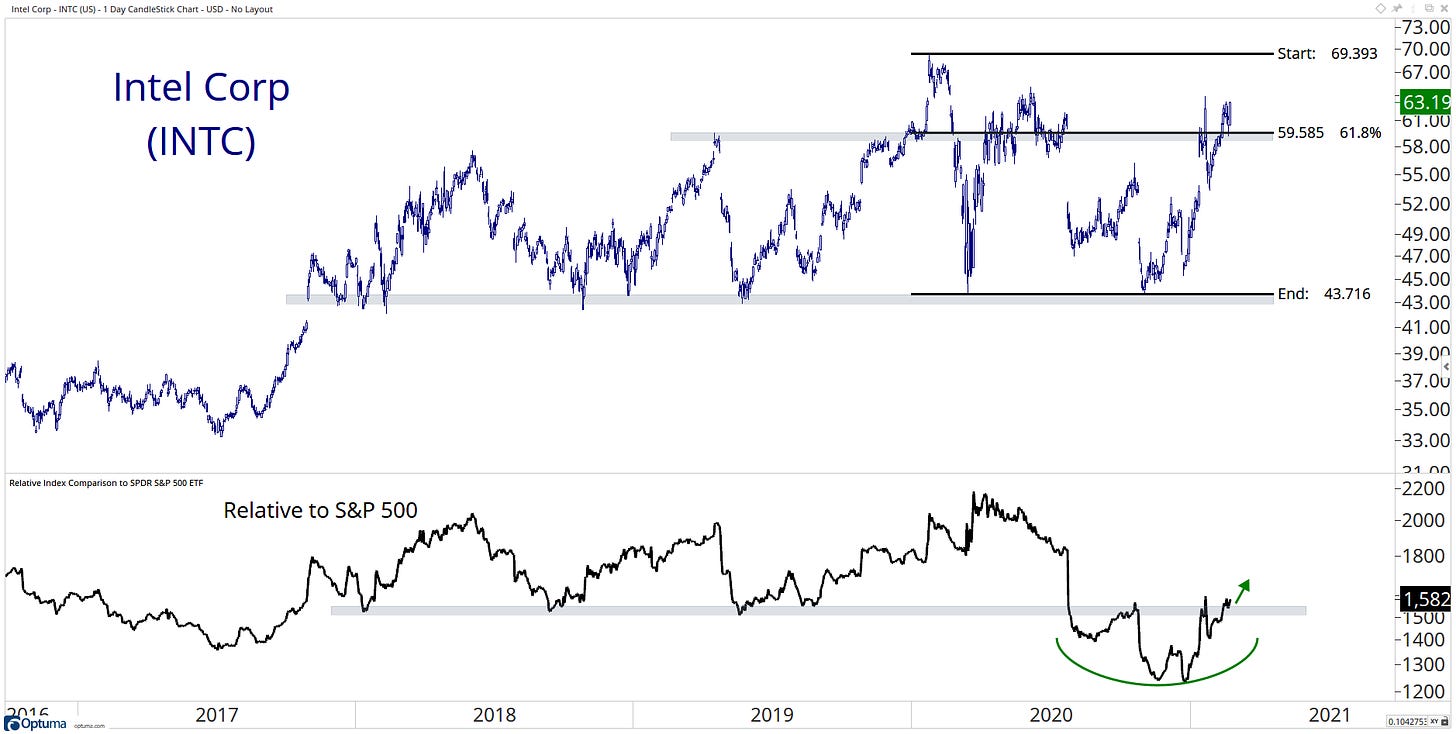
Intel Corp. (INTC) Technology
INTC is a sideways mess at the moment!
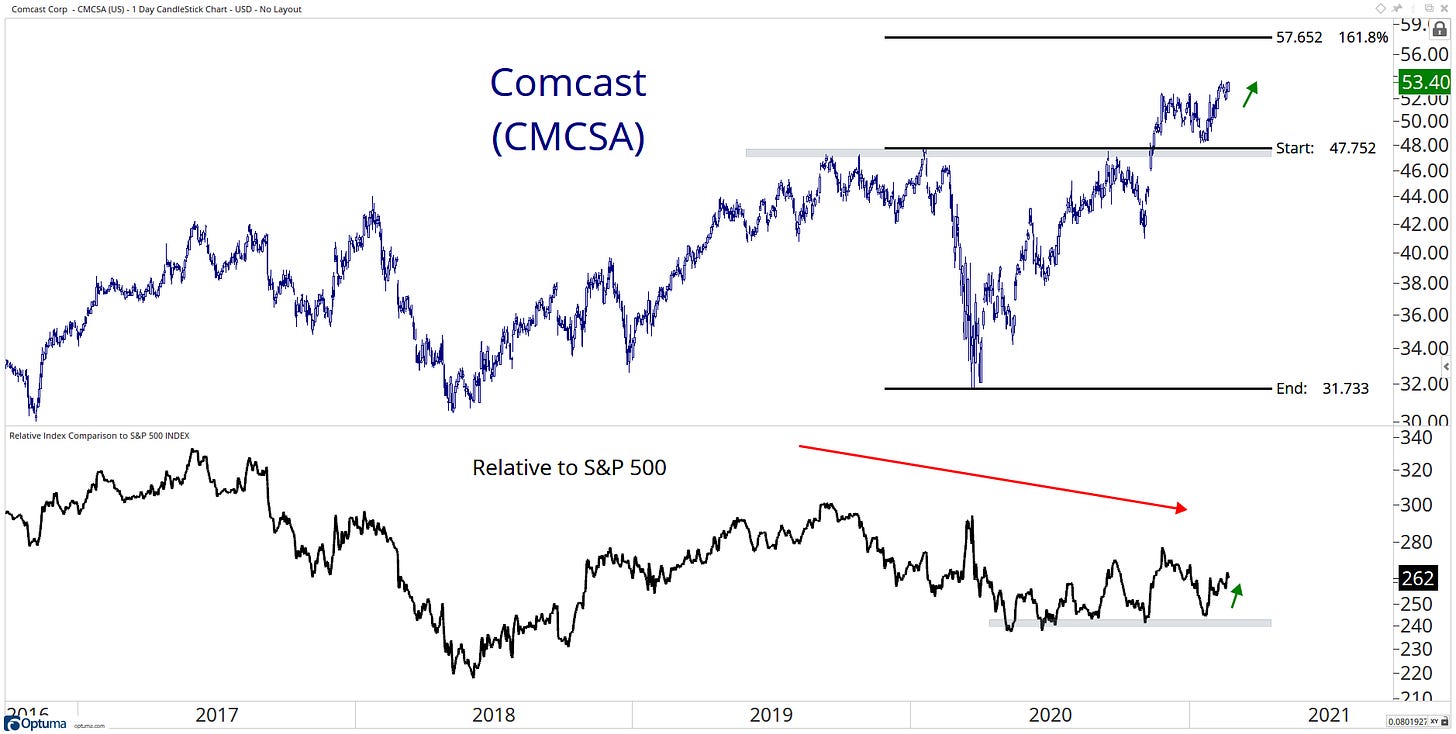
Comcast Corp (CMCSA) Communication Services
Comcast’s move off its March 2020 lows continues to the upside.
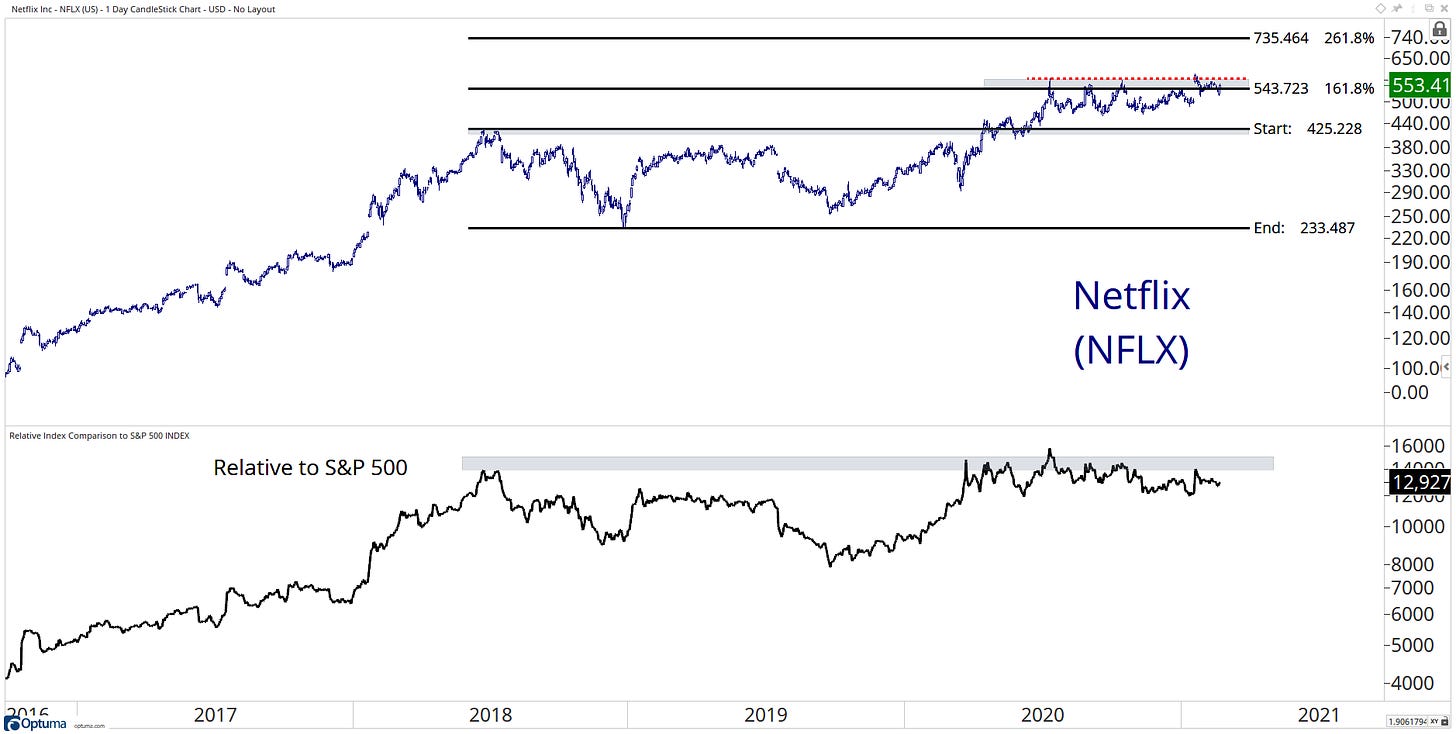
Netflix (NFLX) Communication Services
Netflix has done absolutely nothing for months!
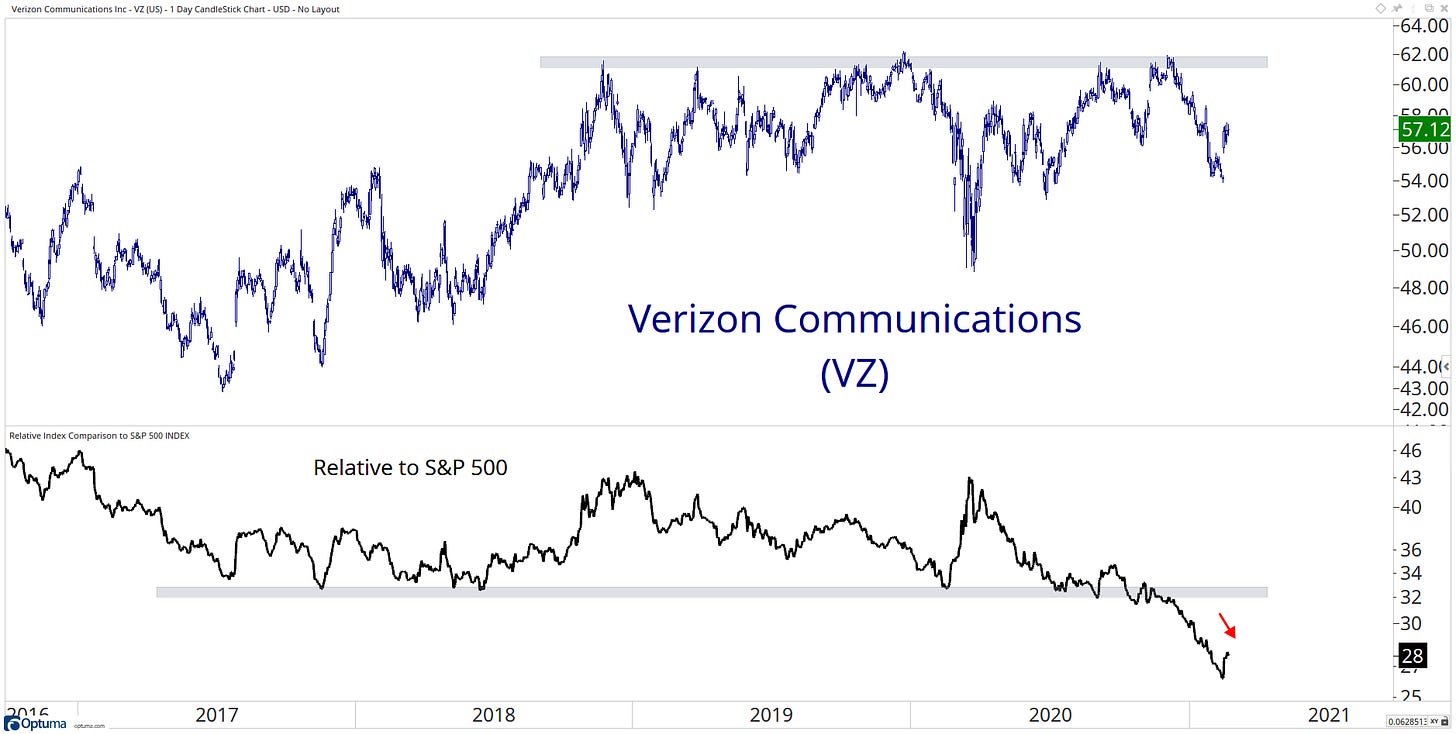
Verizon Communications (VZ) Communication Services
Faded with strong momentum to the downside after price rejected the 61 level.
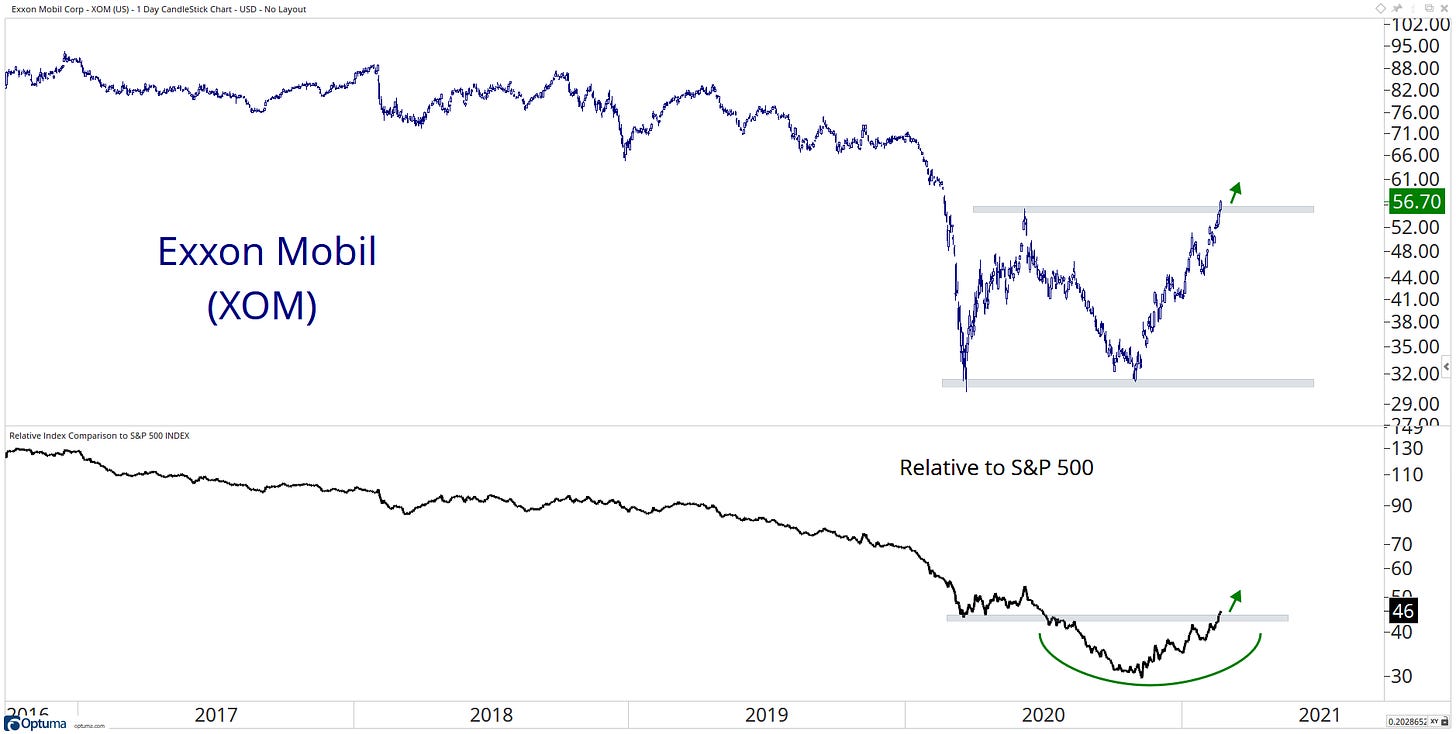
Exxon Mobil (XOM) Energy
52-week highs in XOM is a massive development. Are we now going to see more strong momentum from the energy sector? I think so.
Adobe (ADBE) Technology
The 161.8 fib level seems to be a magnet for Adobe.
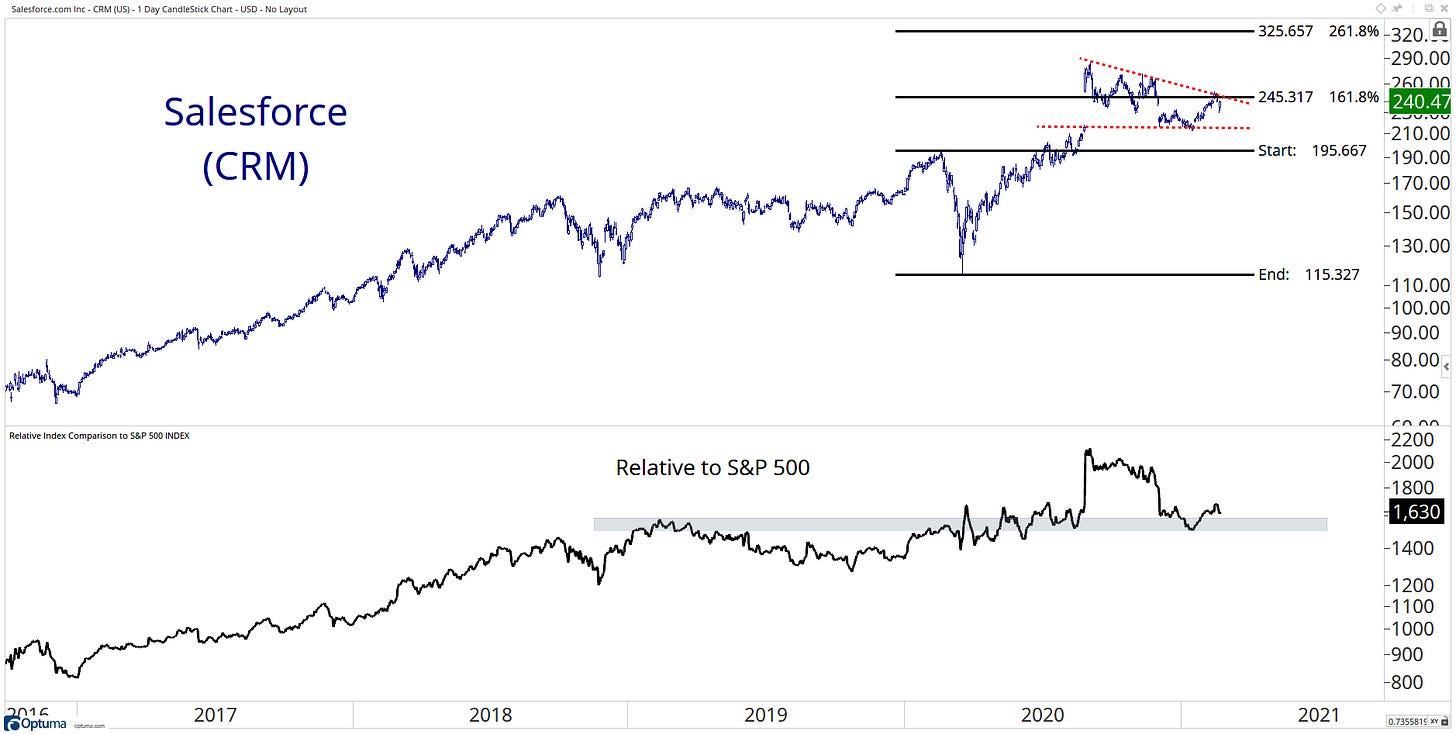
Salesforce.com (CRM) Technology
A descending triangle pattern for Salesforce, the key level to watch is 210.
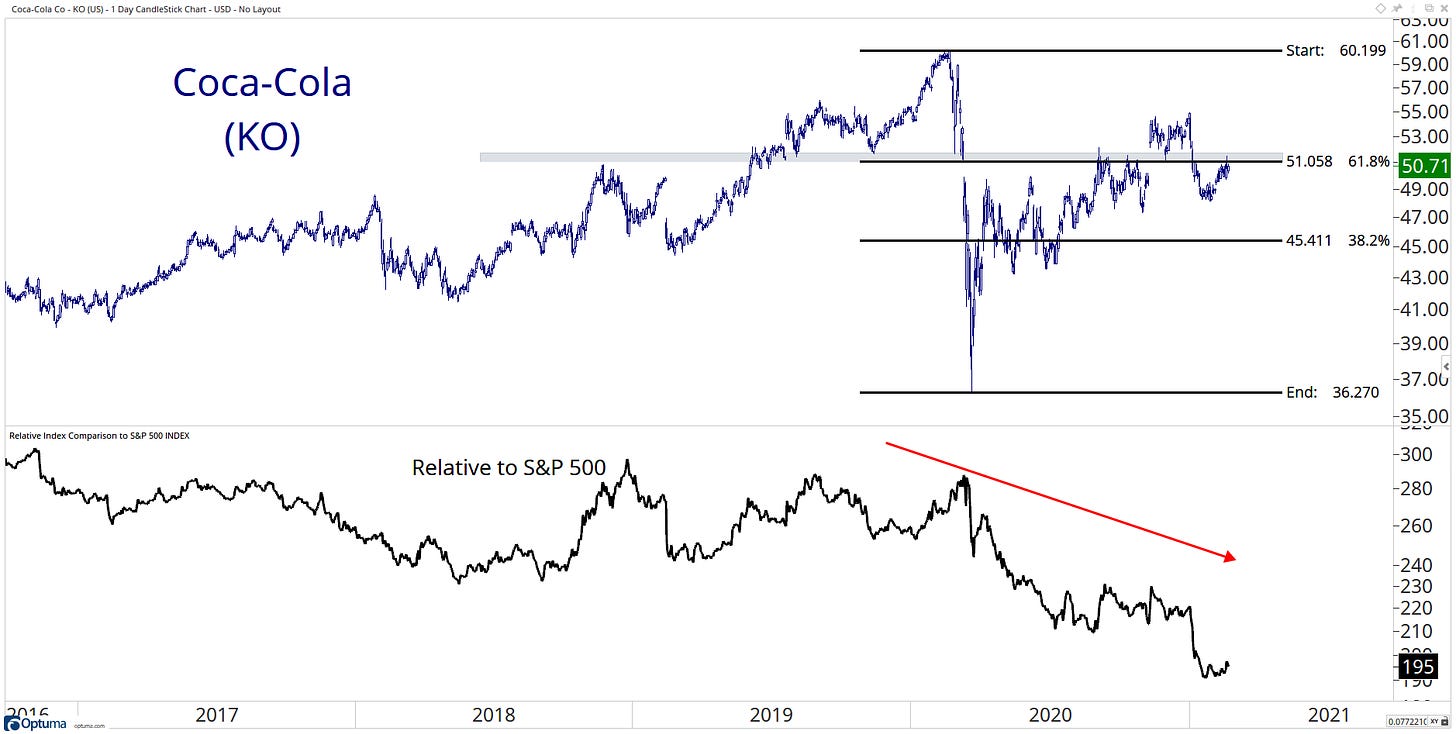
Coca-Cola Co (KO) Consumer Defensive
KO on a relative basis, looks ugly!
Abbott Laboratories (ABT) Healthcare
The uptrend is long and strong for Abbott labs!
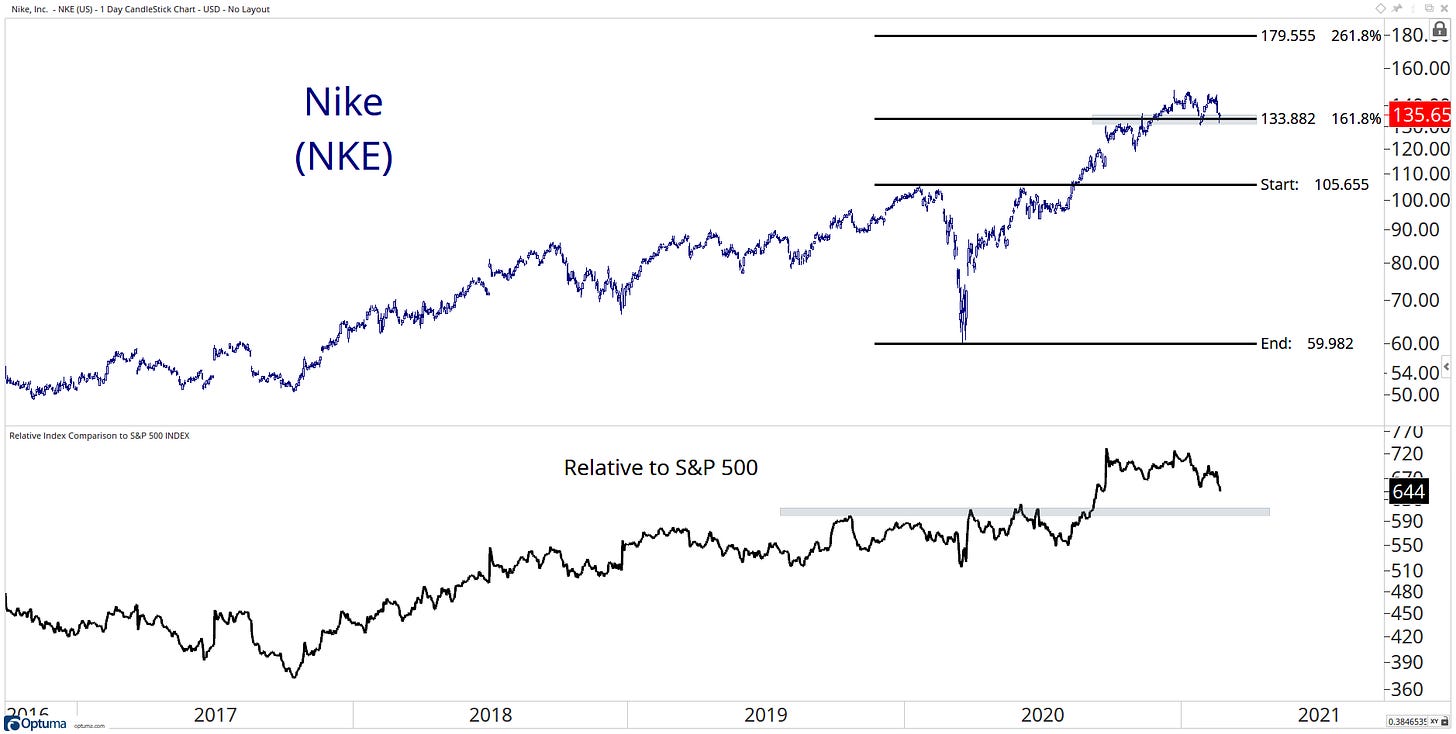
Nike (NKE) Consumer Cyclical
Breakout, re-test… try for another re-test and maybe continuation? Its uptrend is still intact.
AT&T (T) Communication Services
I wouldn’t go anywhere near this... it’s just a hot mess!
That’s a wrap for today. I hope you enjoyed my charts, and please don’t forget to share any of your ideas in the comment section or get in contact with me on Twitter @granthawkridge.
If you enjoyed this blog, please consider sharing for more to see!
Stay safe, and good luck out there…
GH
DISCLAIMER: The information included in this report are obtained from sources which Jotting on Charts believes to be reliable, but we do not guarantee its accuracy. All of the information contained herein should be independently verified and confirmed. All opinions expressed by Jotting on Charts are for informational purposes only. Jotting on Charts is not a financial advisor, and this does not constitute investment advice nor any opinions expressed, constitute a solicitation of the purchase or sale of any securities or related financial instruments. Jotting on Charts is not responsible for any losses incurred from any use of this information. Do not trade with money you cannot afford to lose. It is recommended that you consult a qualified financial advisor before making any investment decisions.


