In this post, I will highlight three of the most important charts that I saw at yesterdays market close along with short commentary on each.
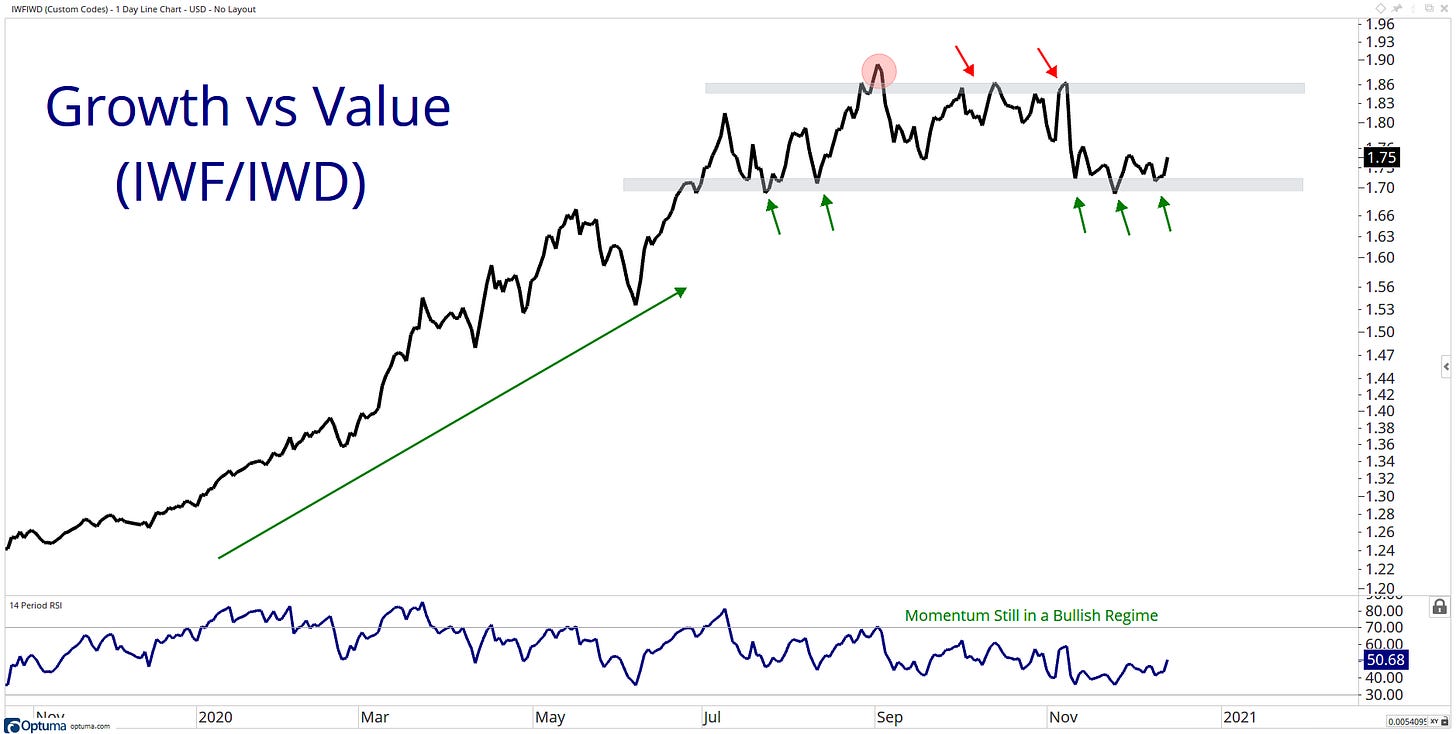
The Growth $IWF vs Value $IWD ratio has seen quite the change in the character of its trends of late, its been range-bound since July.
The momentum of its huge uptrends has cooled off, and there are only three possibilities for this trend moving forward:
Growth continues its leadership (Breakout to the upside)
The Growth vs Value trend becomes neutral (ratio continues between drawn channel)
Does value begin outperforming Growth for the first time in many years? maybe? (Breakout to the downside)
The big question that is getting asked on Twitter is, will this turn into meaningful rotation into Value? And if so, what is the implications to the market?
This chart has so much information! I love it!
Treasury yields typically rise as confidence in the economy improves, I see treasury yields has based and has turned higher.
And with copper, it tends to rise relative to gold as growth expectations improve, once again I see copper relative to gold which has based and turned higher also.
Will we see a tailwind for this change of direction? maybe… time will tell.
Reflation trade… cyclical rotation… and risk-appetite... but let’s not forget about Commodities!
Here is the Commodities Index $CCI knocking on the door to a serious level of resistance! And can you not see that 5+ year big booty base! Wowee!
To me, this is a sign of healthy risk appetite. Are we ready for a substantial move above 440?
That’s a wrap for today, hope you enjoyed my charts, and please don’t forget to share your ideas in the comment section or get in contact with me on Twitter @granthawkridge.
Stay safe and good luck out there…
GH
DISCLAIMER: The information included in this report are obtained from sources which Jotting on Charts believes to be reliable, but we do not guarantee its accuracy. All of the information contained herein should be independently verified and confirmed. All opinions expressed by Jotting on Charts are for informational purposes only. Jotting on Charts is not a financial advisor, and this does not constitute investment advice nor any opinions expressed, constitute a solicitation of the purchase or sale of any securities or related financial instruments. Jotting on Charts is not responsible for any losses incurred from any use of this information. Do not trade with money you cannot afford to lose. It is recommended that you consult a qualified financial advisor before making any investment decisions.


