Weight of the evidence - February
A look at my monthly chartbook of 100 of the most important charts
We have all been there…
We all have seen others do it too…
We observe one chart, and then all of a sudden, we are drawing broad base conclusions on that one chart.
Well, this is just a silly approach when looking at the markets!
The first thing we need to do is take a deep breath……….. Are you feeling better now? Yeah? ok, good!…
Now we need to ask ourselves, “How does this new chart fit within the context of all the other charts?” then, we want to identify how much importance we want to put on this particular chart. So, we need to take a step back, evaluate all of the charts, weigh the evidence and then come up with our conclusions.
Is it only me that gets excited when we get a new batch of monthly candlesticks? Looking at these type of charts would have to be my favourite exercise each month.
The value I obtain from ripping over my monthly chartbook of 100 of the most important charts from around the world is just priceless. Without a doubt, nothing else I do throughout my entire process provides this much value for me.
I have always been told, whenever in doubt, zoom out. The longer-term view helps put things into perspective and makes it near impossible to ignore the primary trend. It's all about that Dow theory baby!
So, let’s get stuck into those 100 monthly charts:
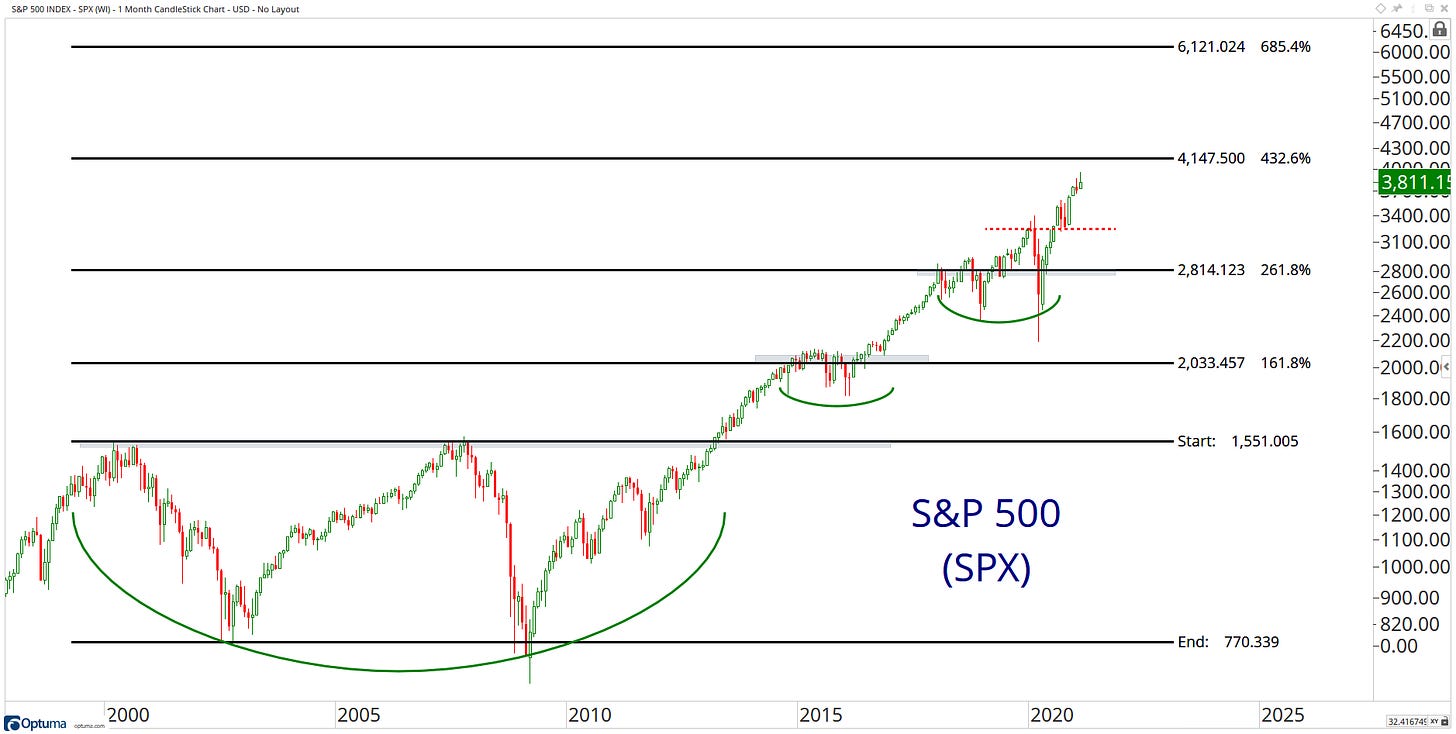
1. S&P 500 INDEX - SPX
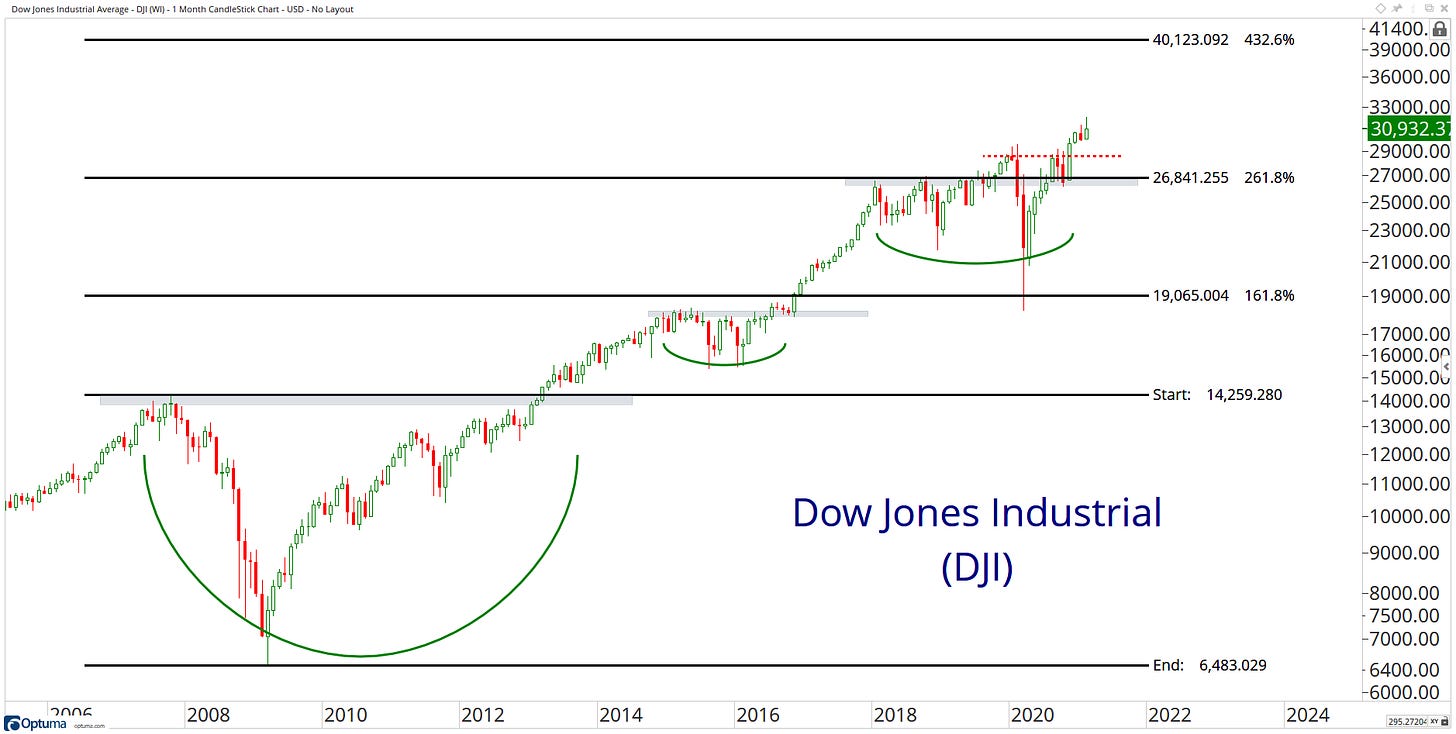
2. Dow Jones Industrial Average - DJI
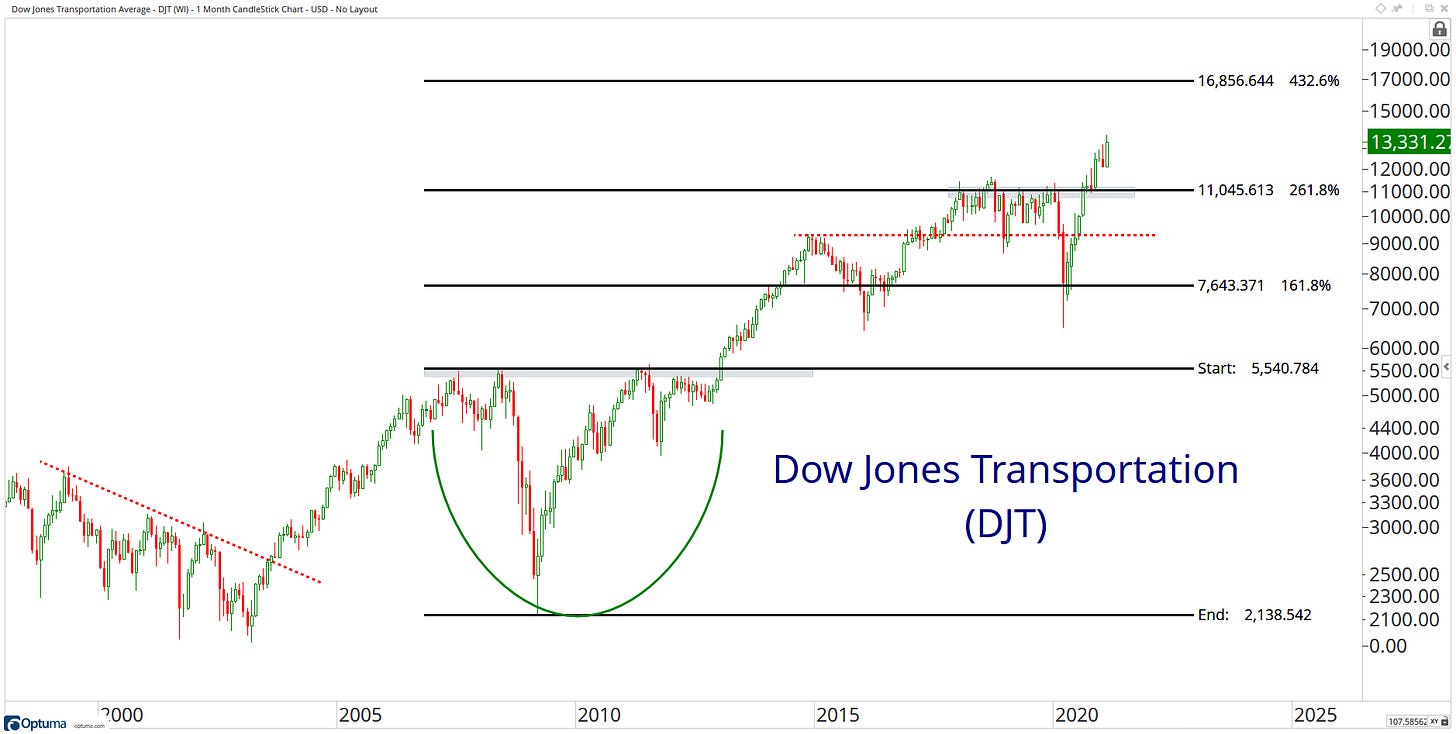
3. Dow Jones Transportation Average - DJT
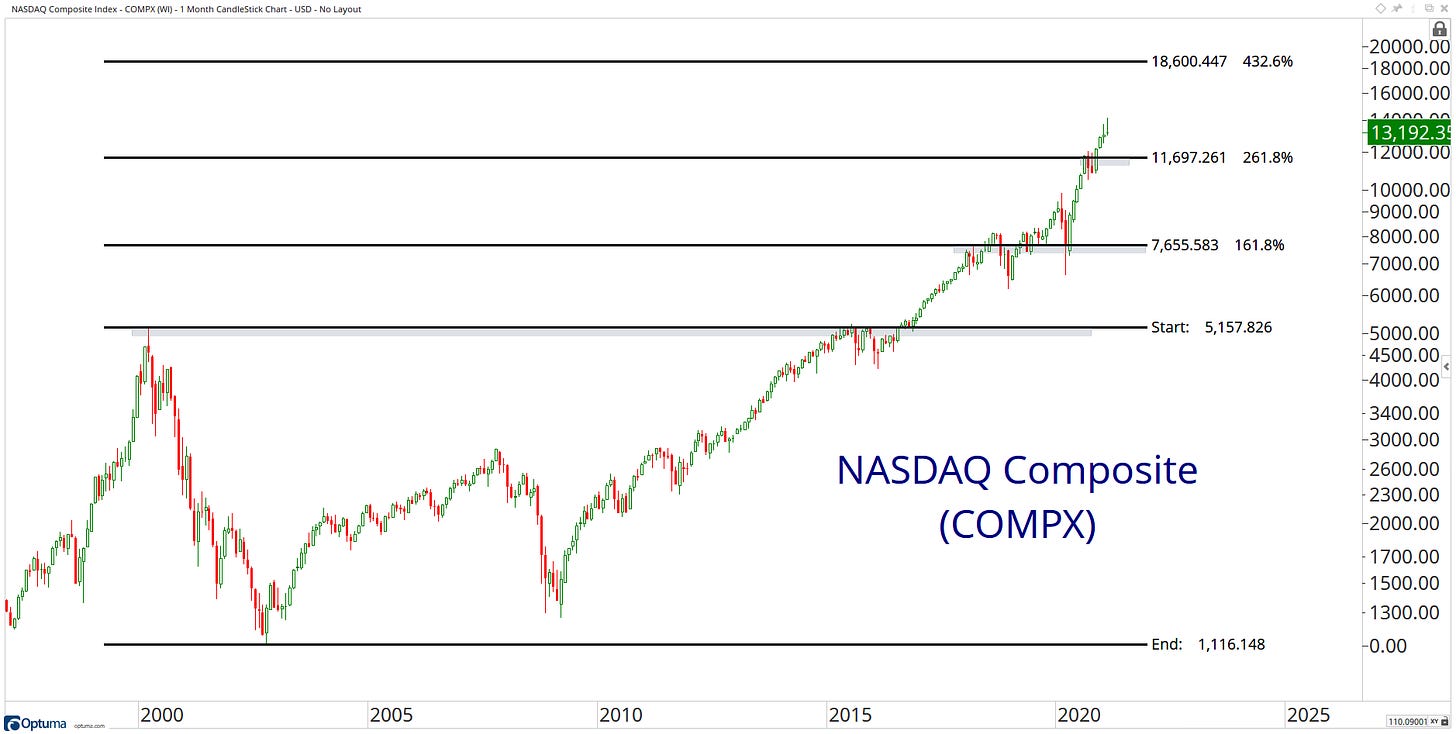
4. NASDAQ Composite Index - COMPX
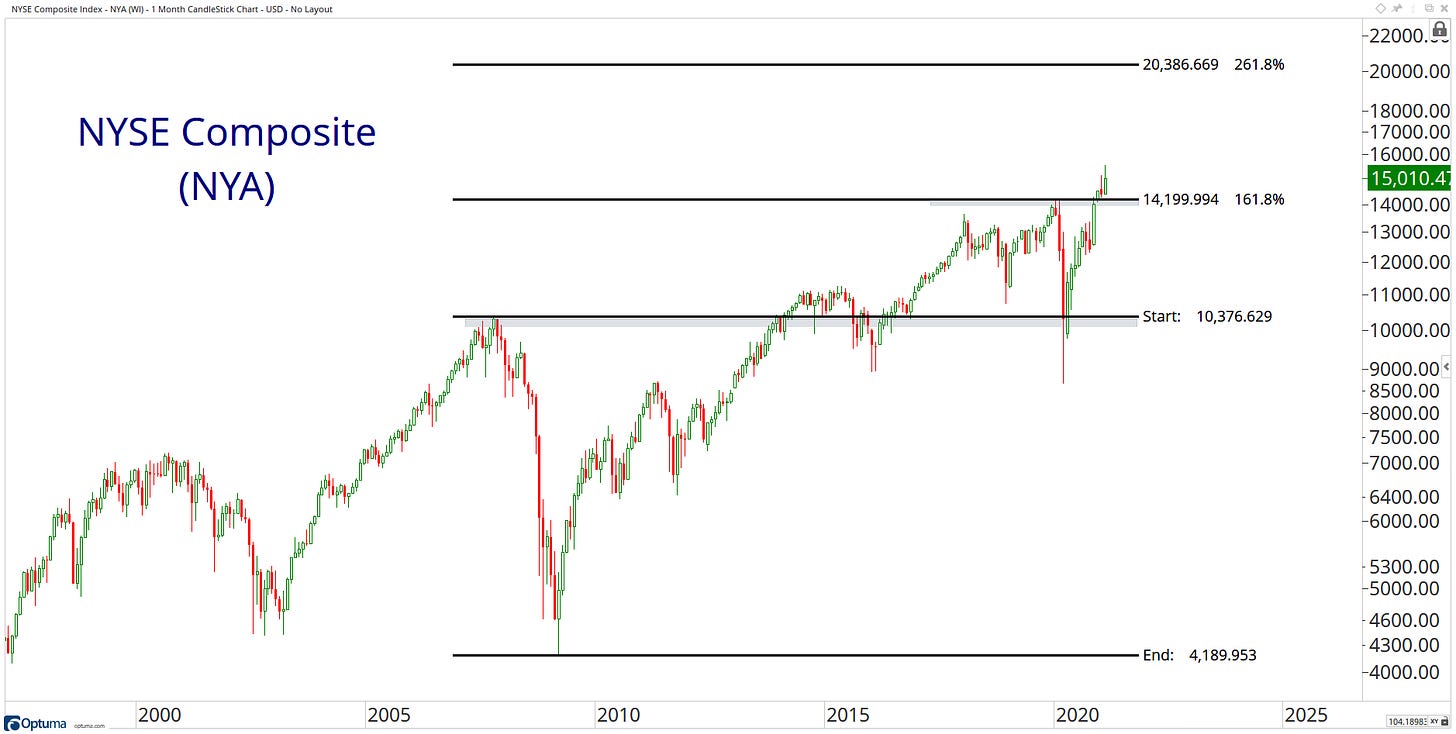
5. NYSE Composite Index - NYA
6. Invesco QQQ Trust - QQQ
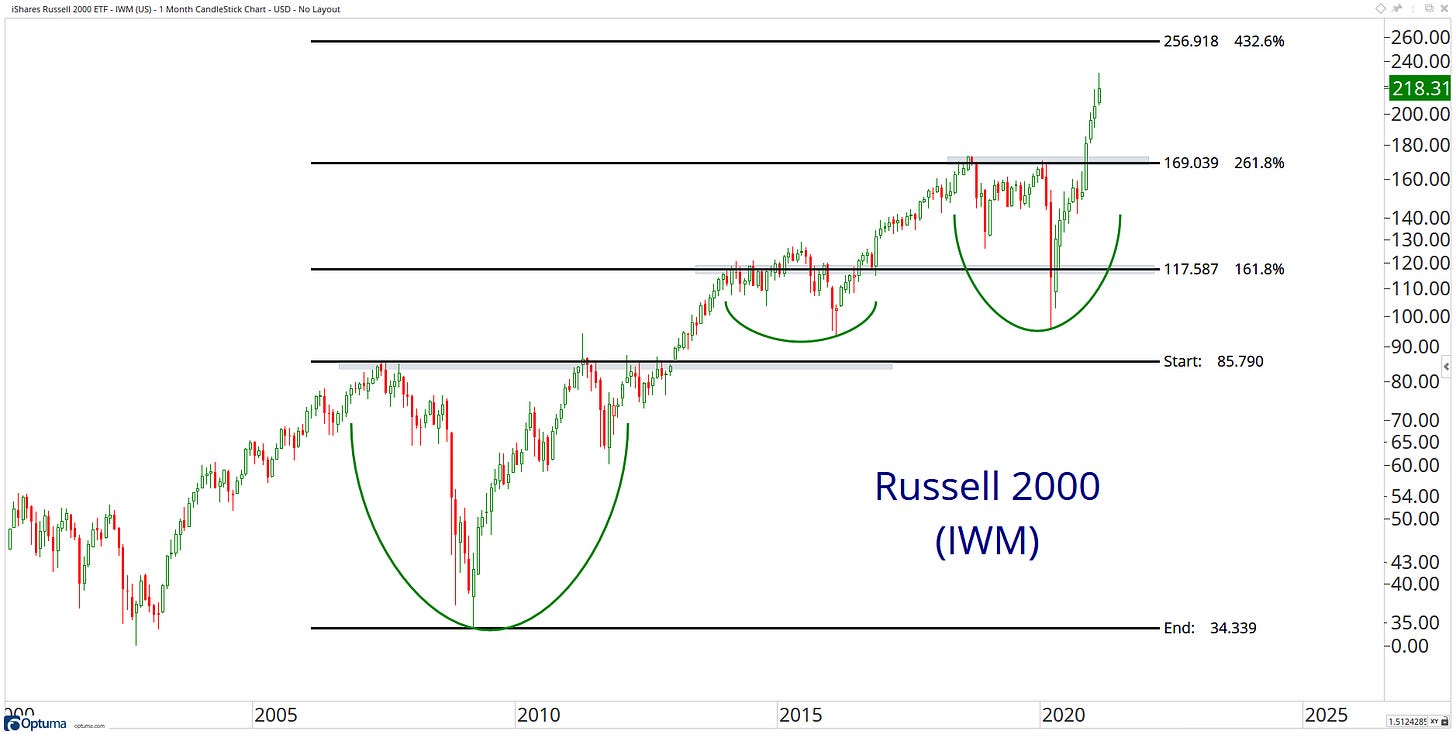
7. iShares Russell 2000 ETF - IWM
8. IWM / QQQ
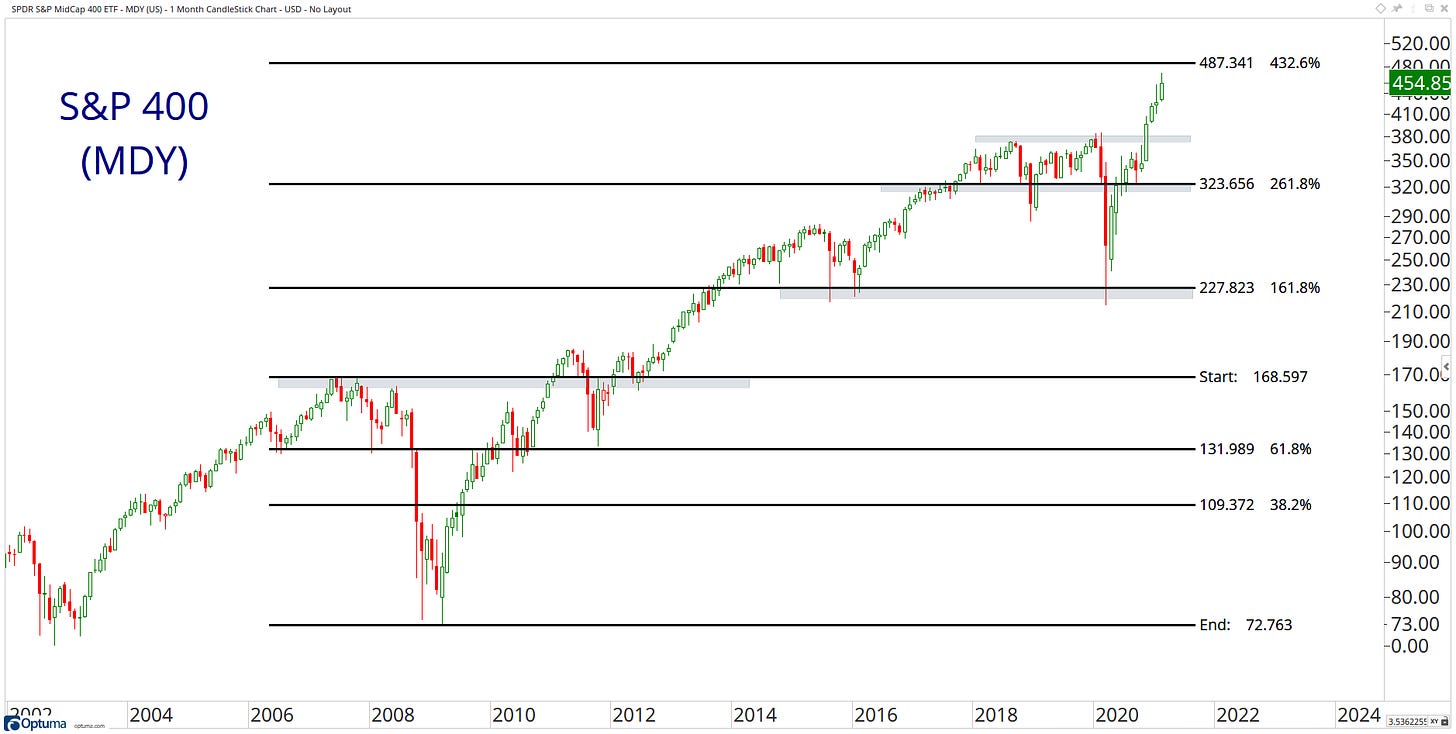
9. SPDR S&P MidCap 400 ETF - MDY
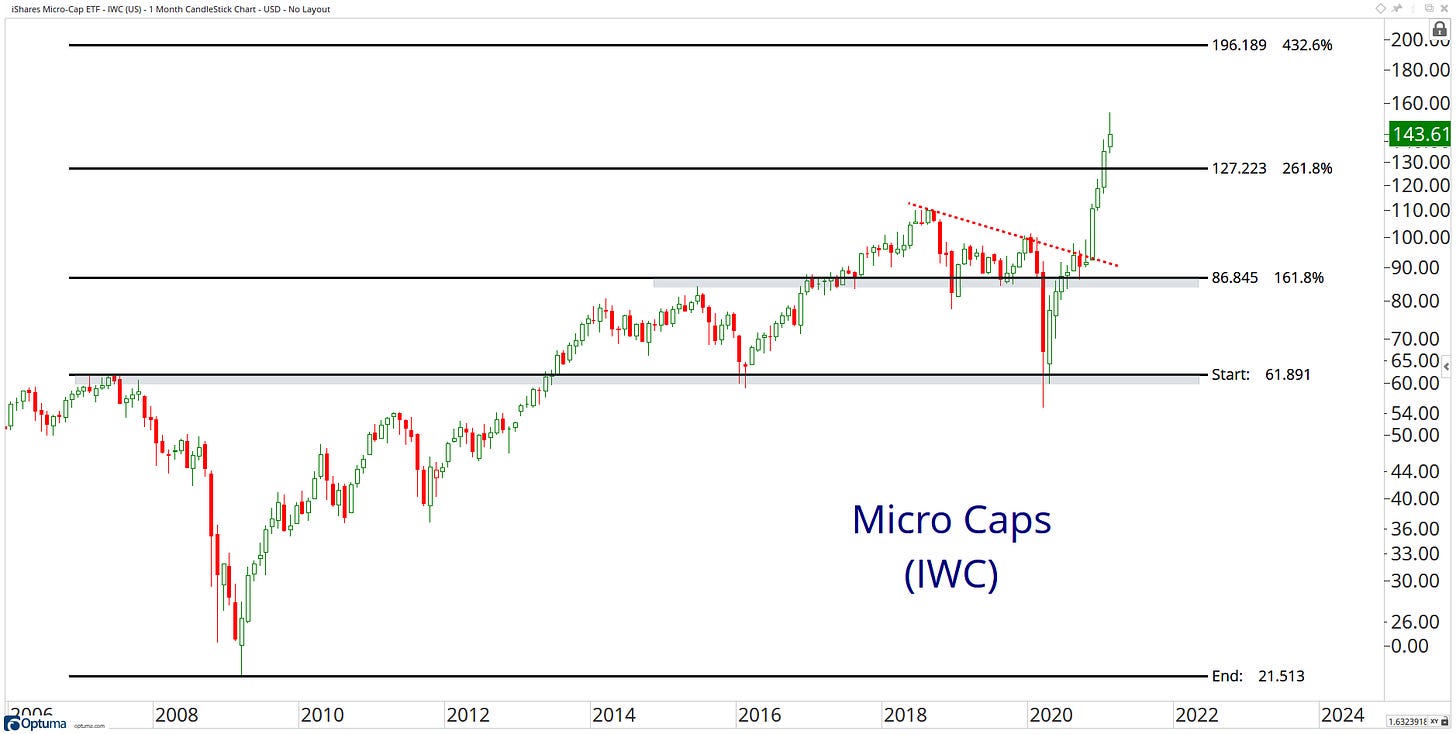
10. iShares Russell Microcap Index Fund ETF - IWC
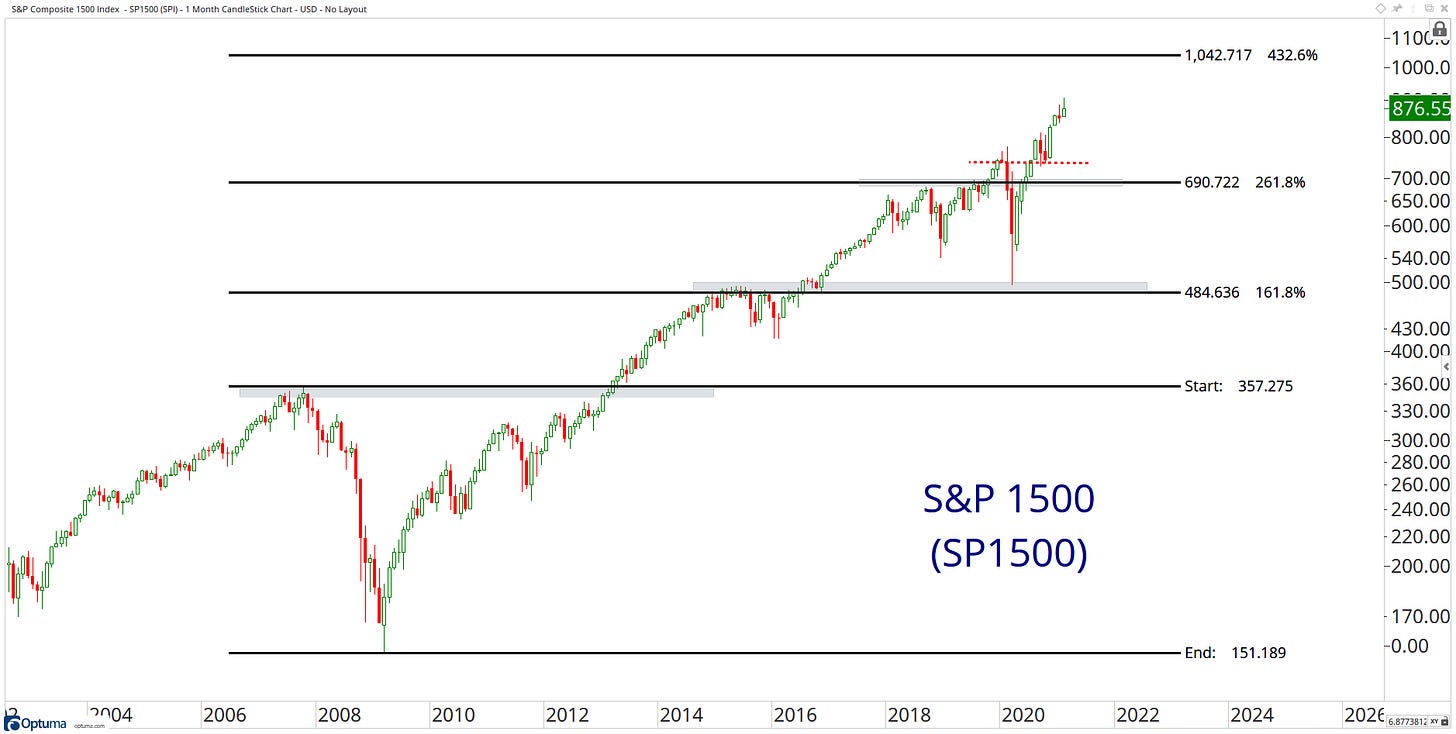
11. S&P Composite 1500 Index - SP1500
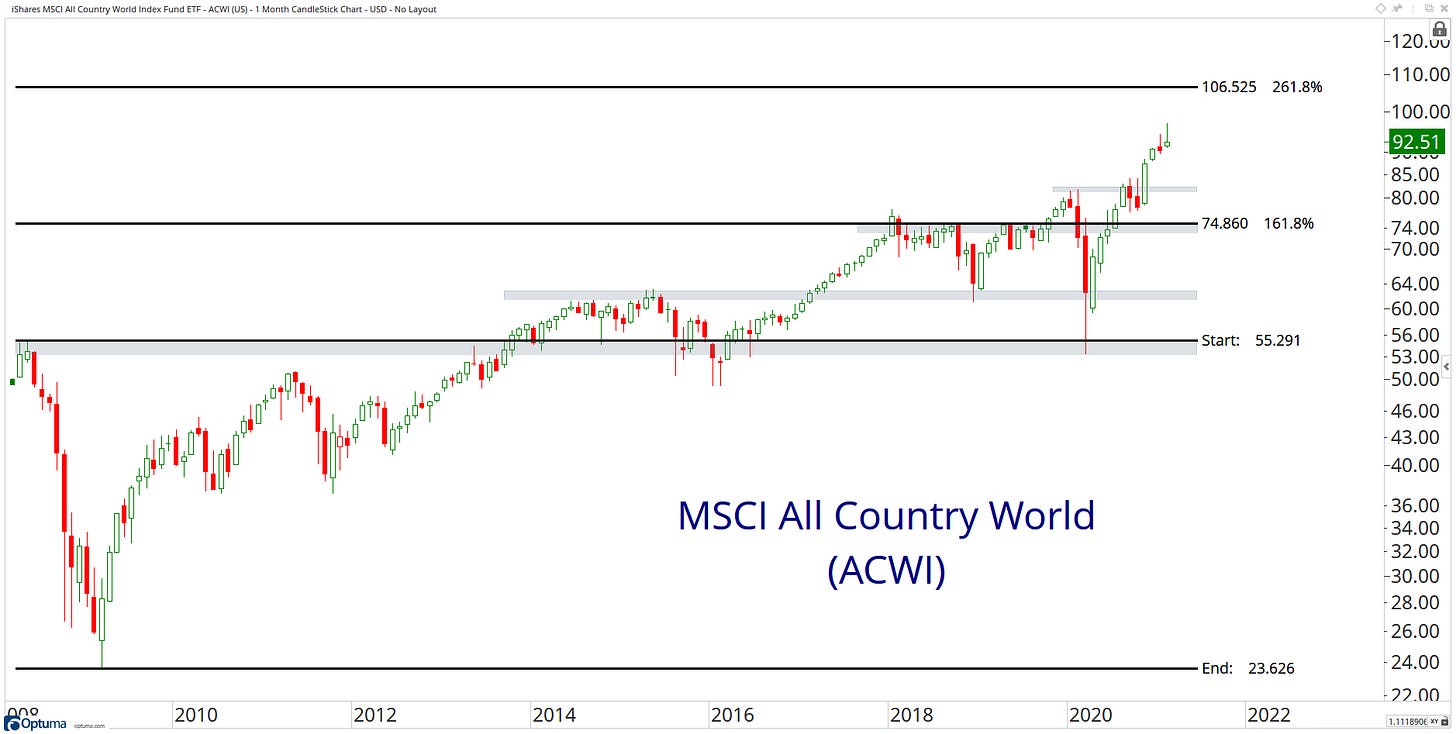
12. iShares MSCI All Country World Index Fund ETF - ACWI
13. iShares S&P Global 100 Index Fund ETF - IOO
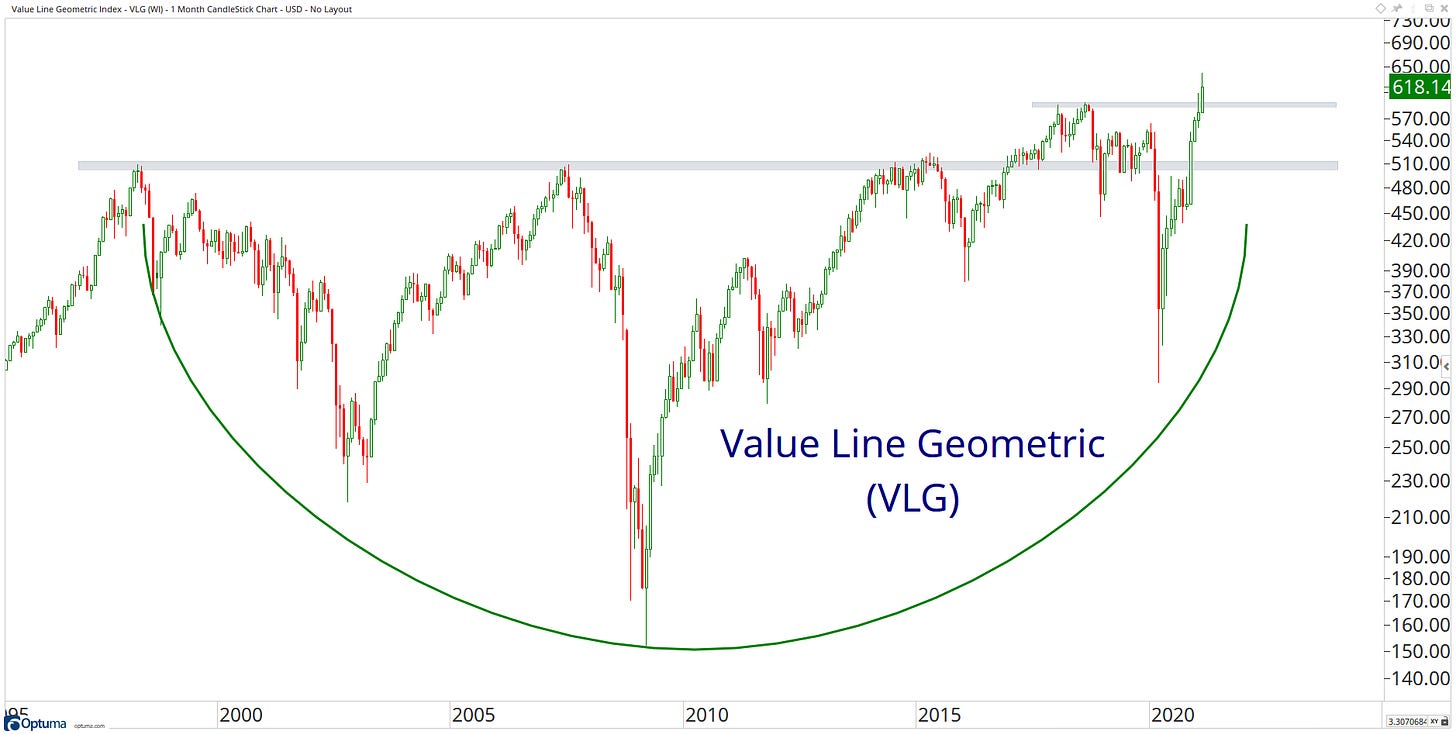
14. Value Line Geometric Index - VLG
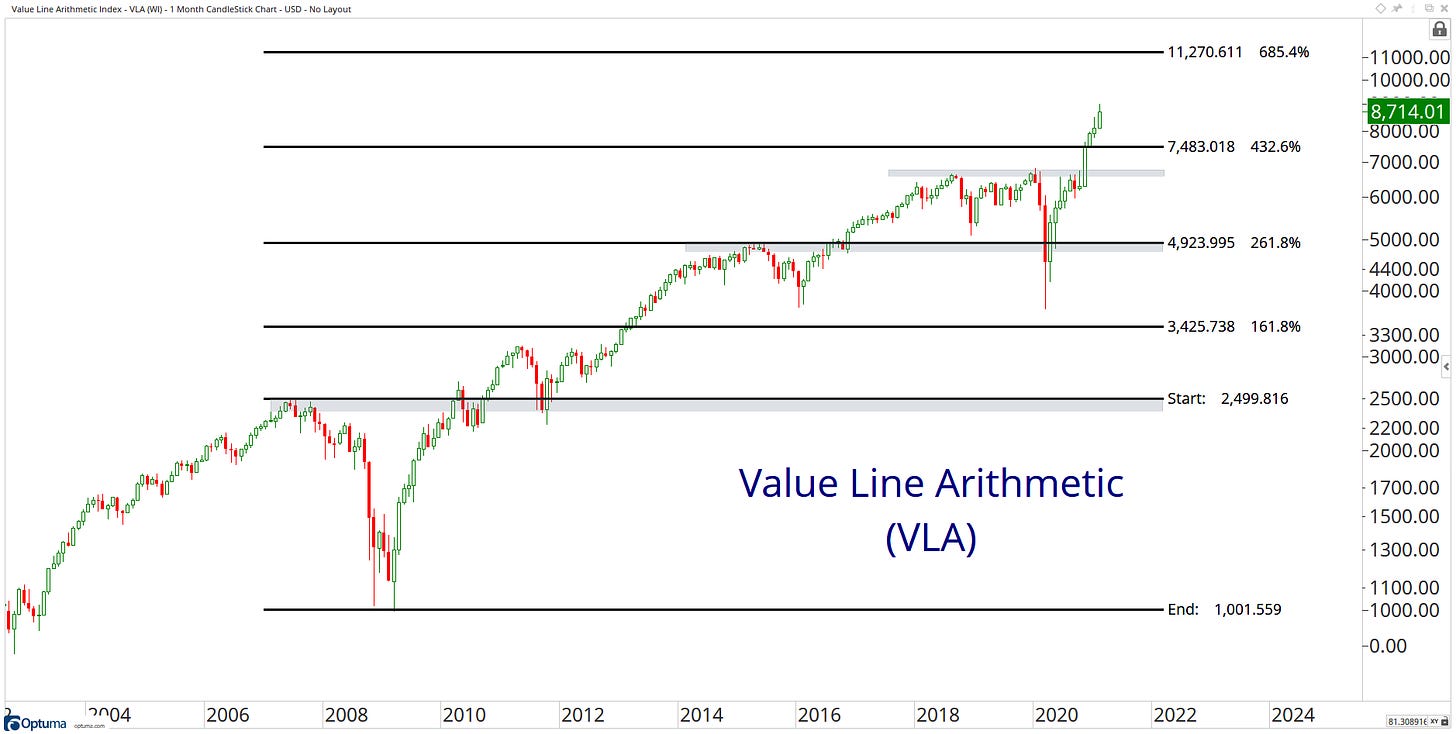
15. Value Line Arithmetic Index - VLA
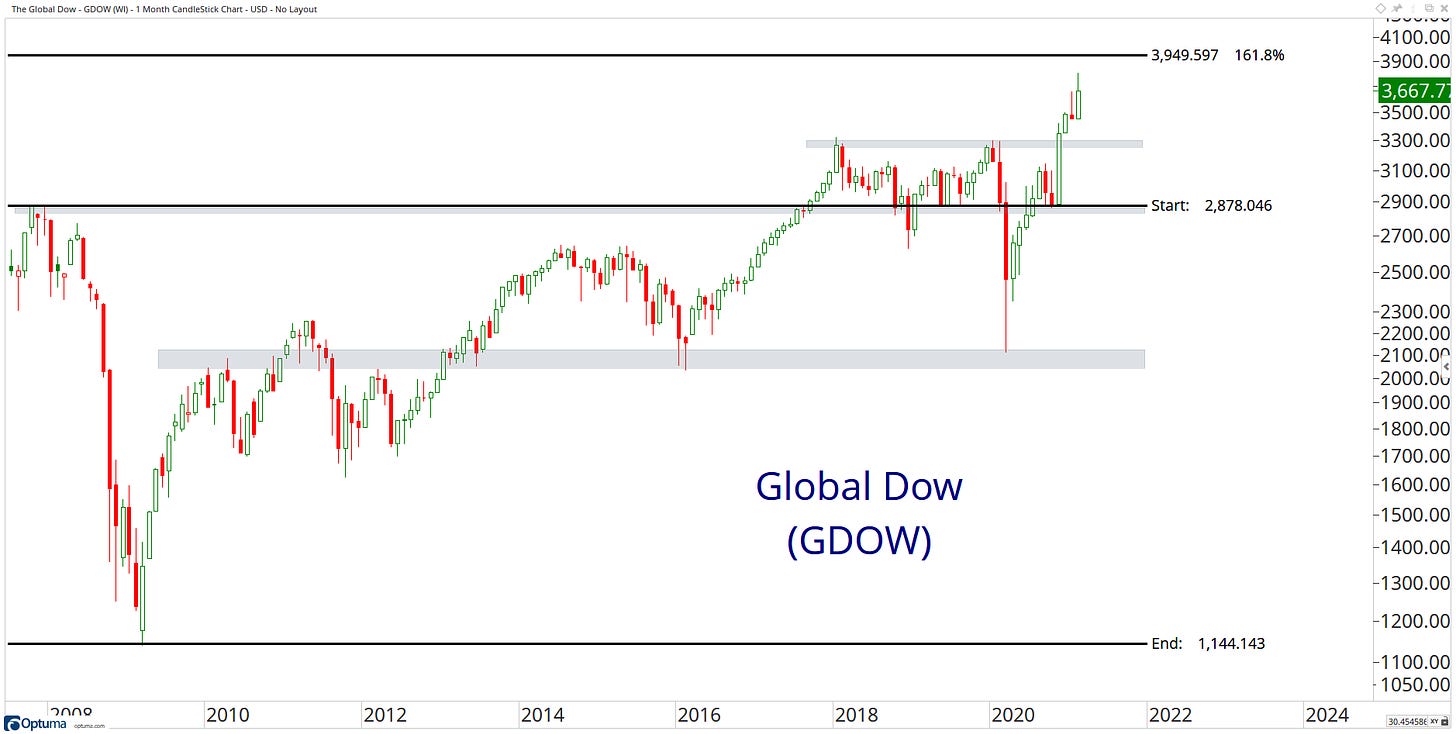
16. The Global Dow - GDOW
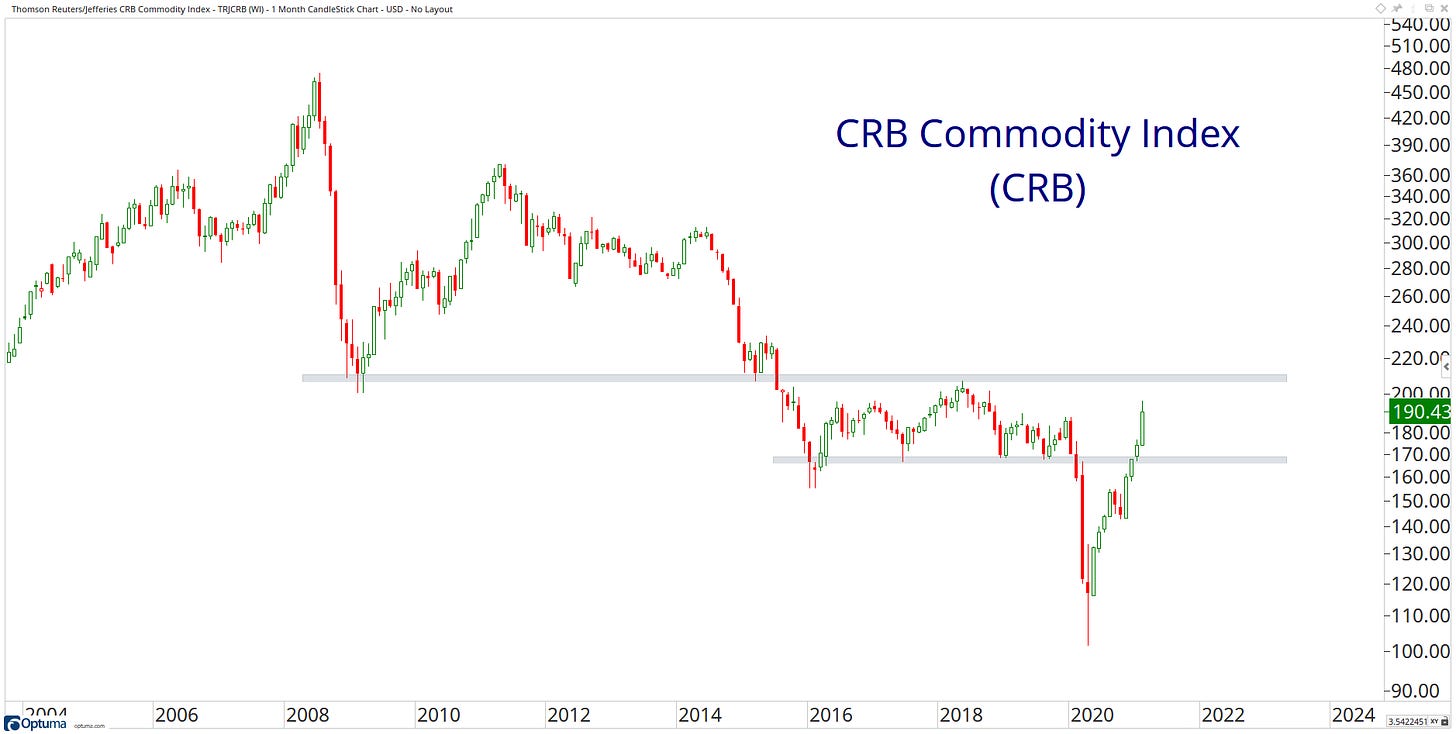
17. Thomson Reuters/Jefferies CRB Commodity Index - TRJCRB
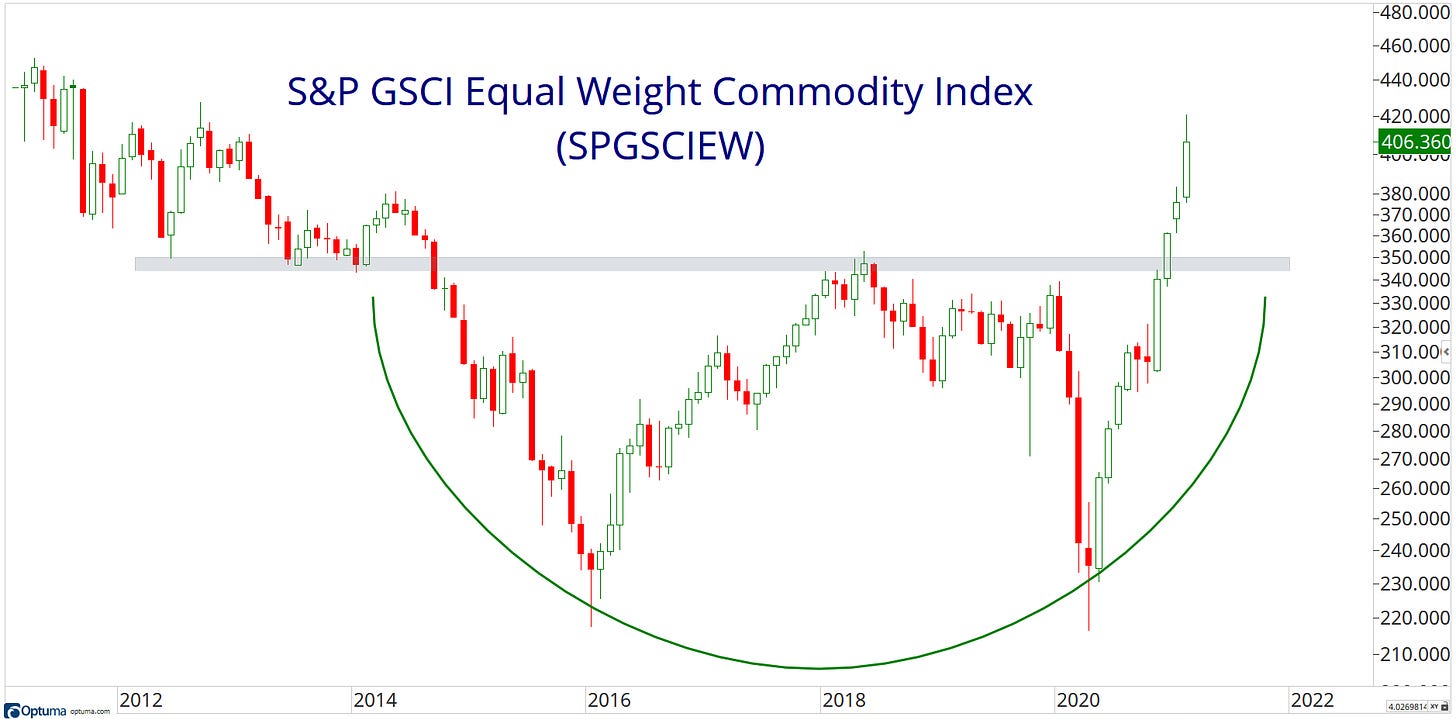
18. S&P GSCI Equal Weight Commodity Index - SPGSCIEW
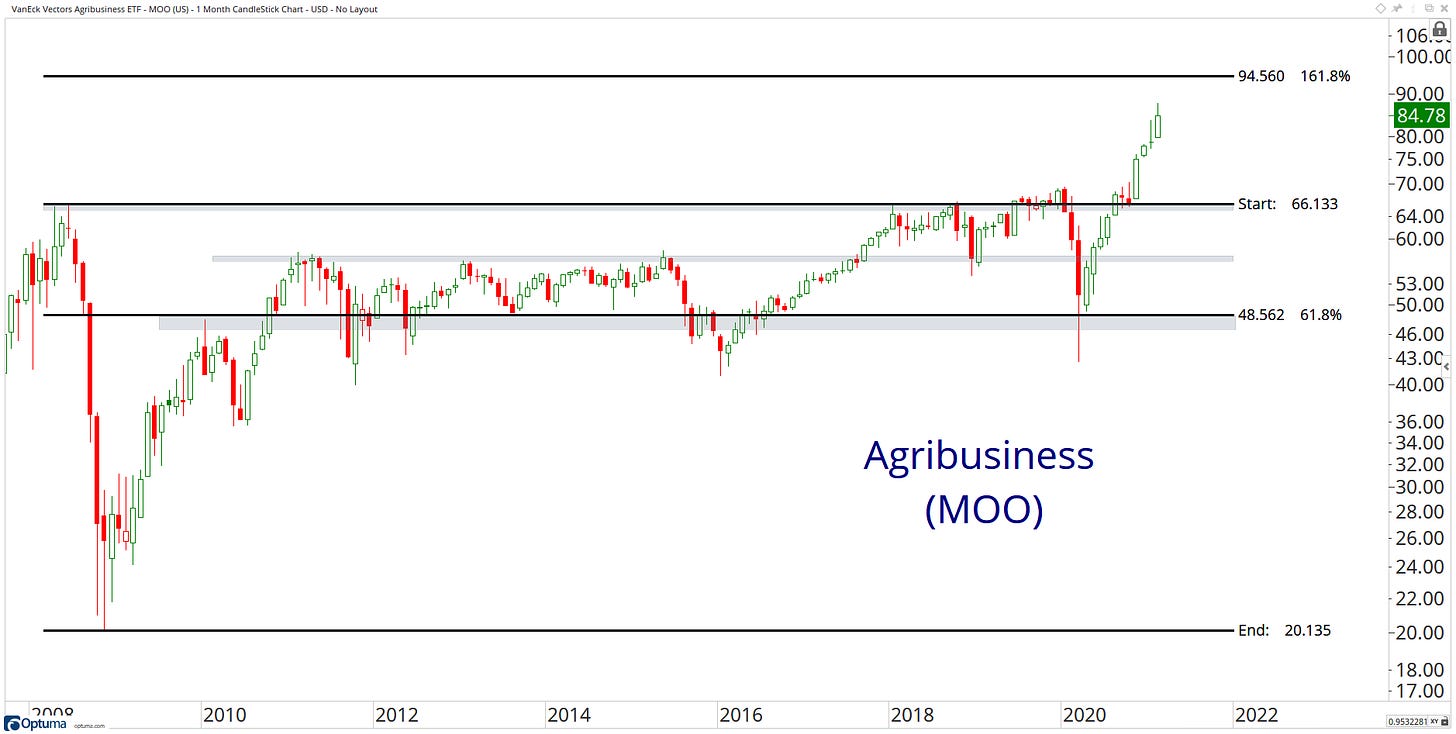
19. VanEck Vectors Agribusiness ETF - MOO
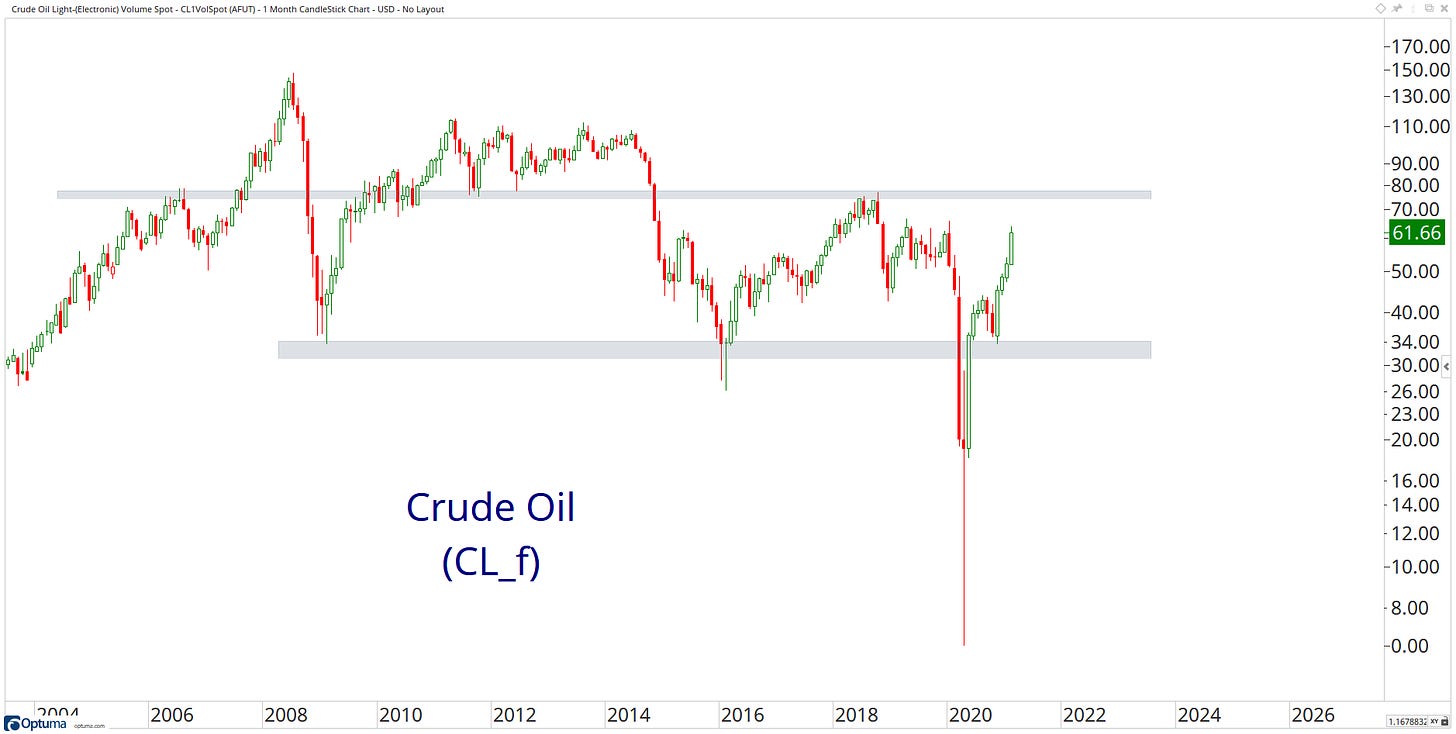
20. Light, Sweet Crude Oil Futures - CL2Spot
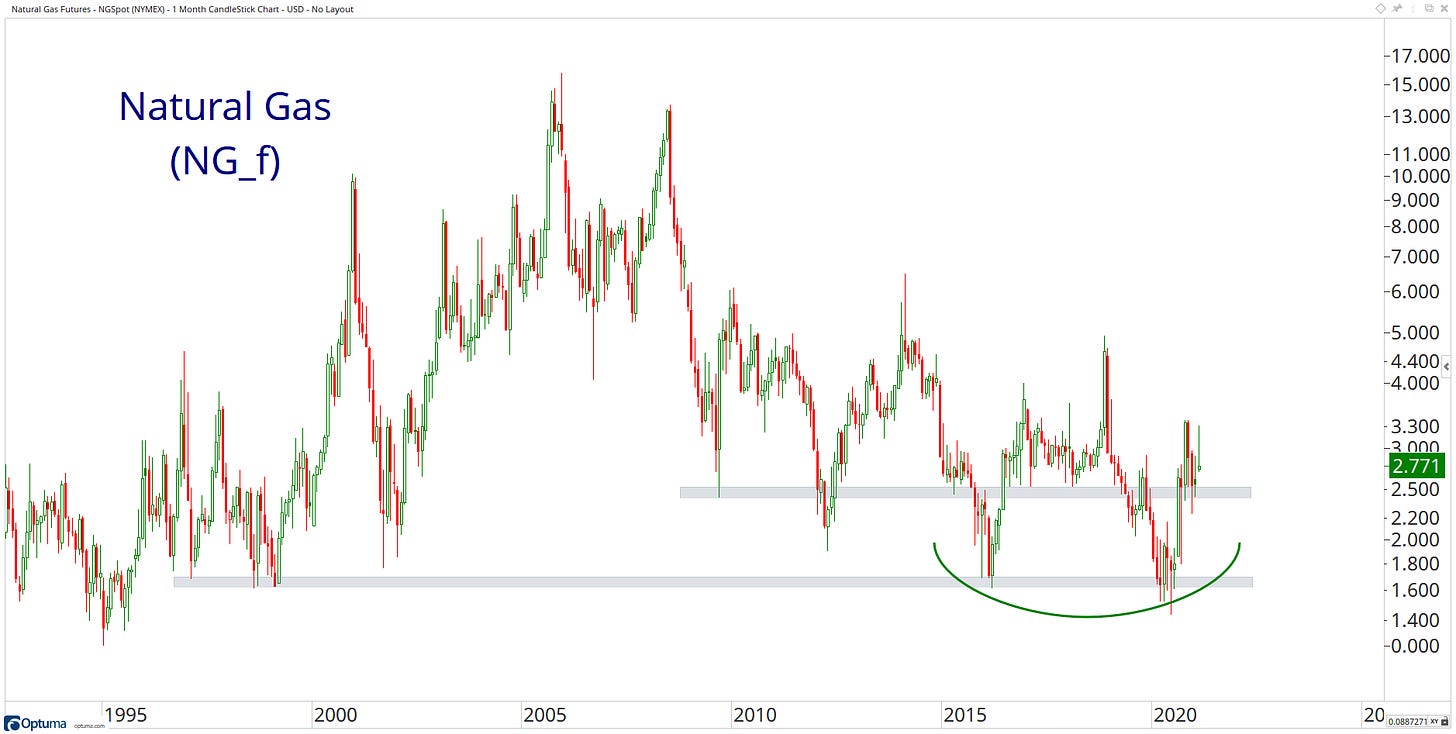
21. Natural Gas Futures - NGSpot
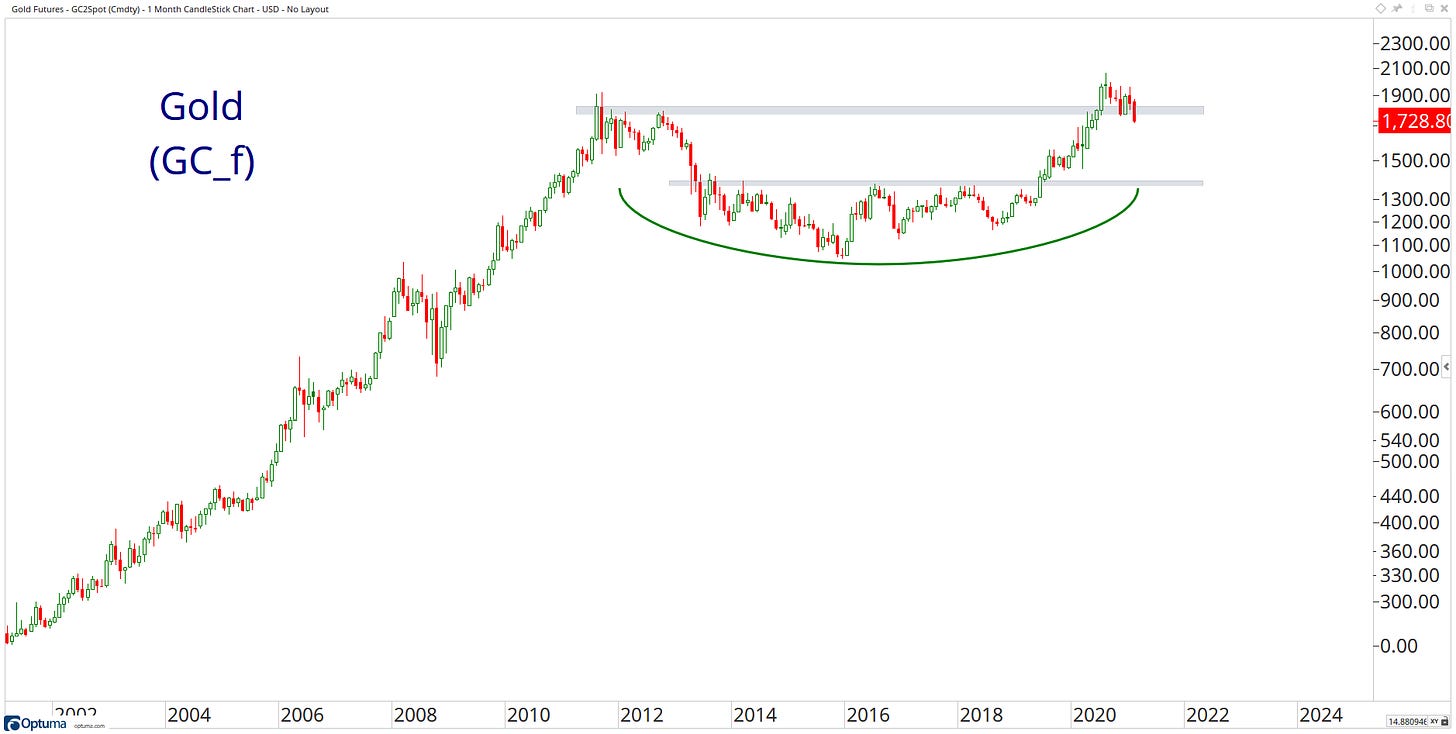
22. Gold Futures - GC2Spot
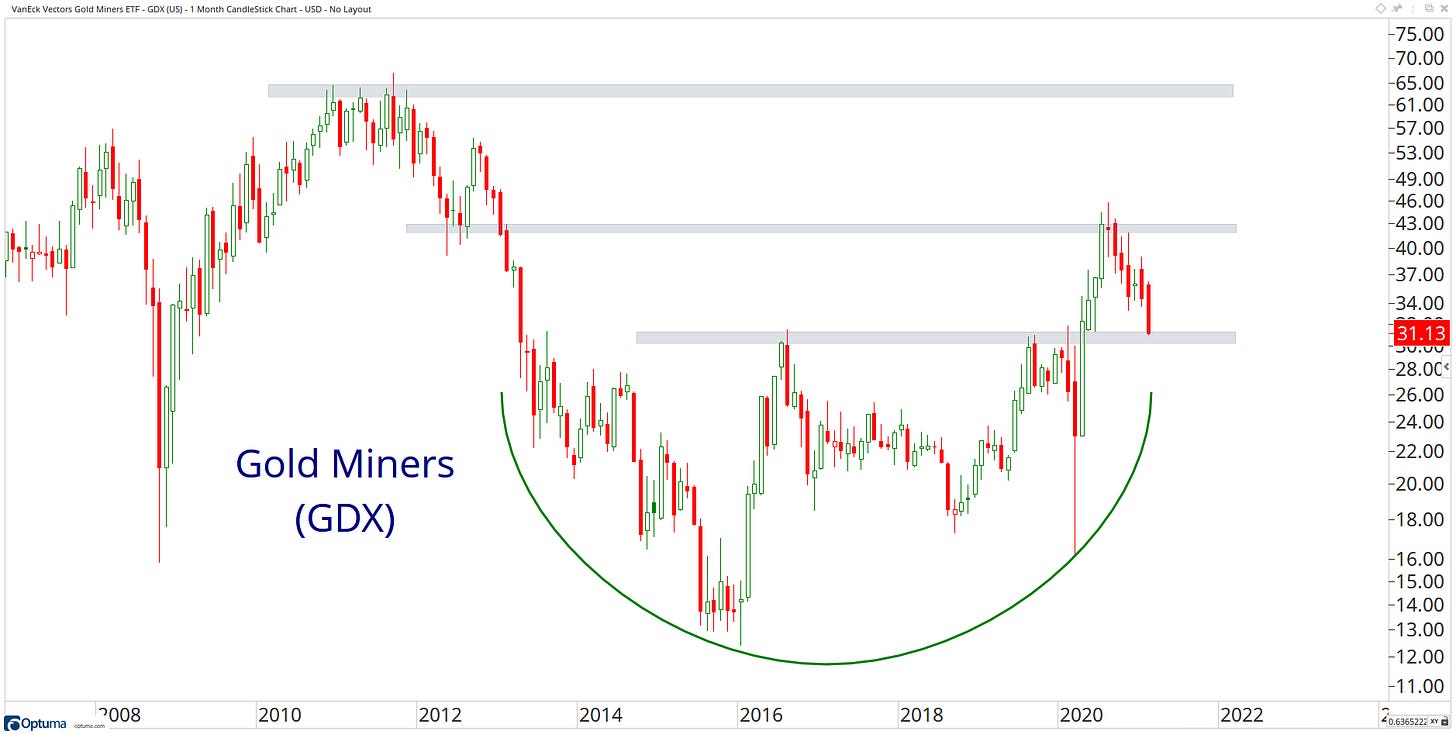
23. VanEck Vectors Gold Miners ETF
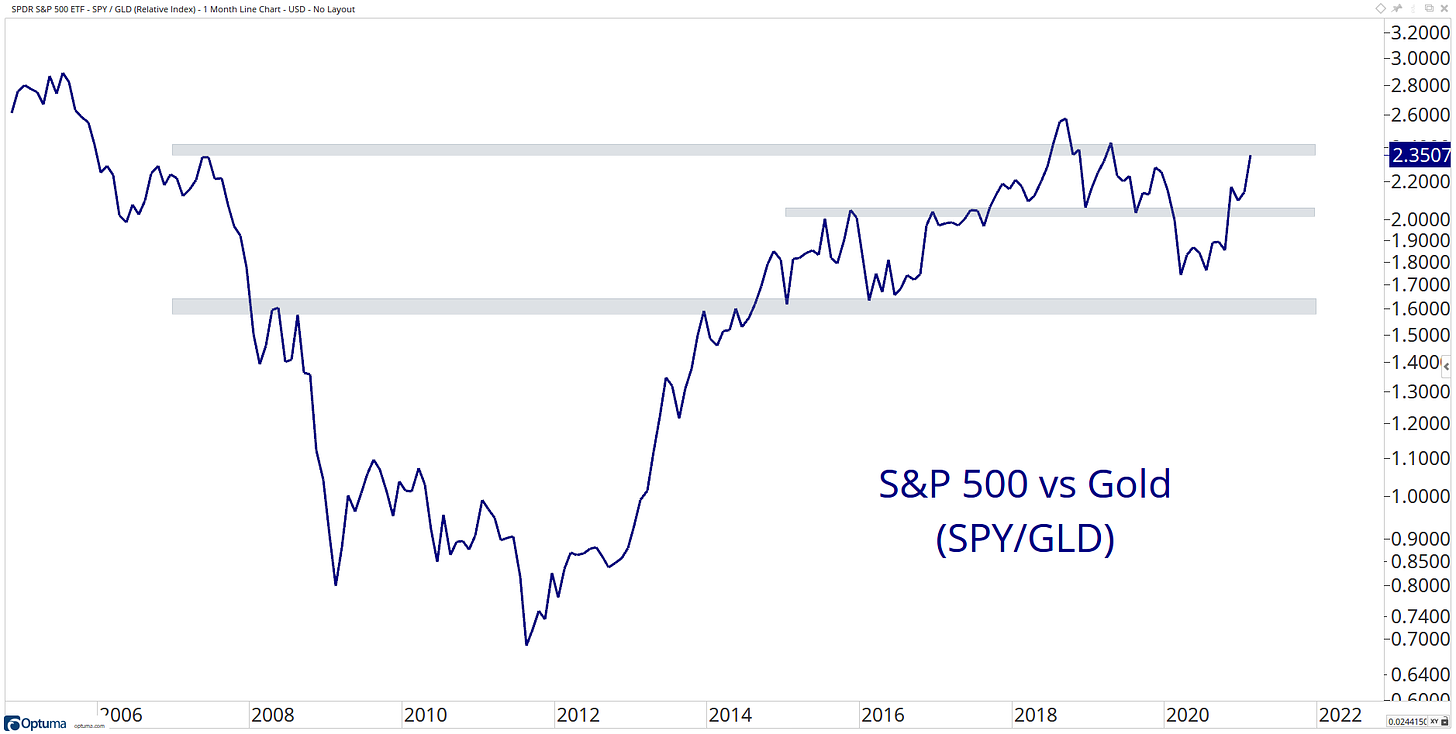
24. SPY / GLD
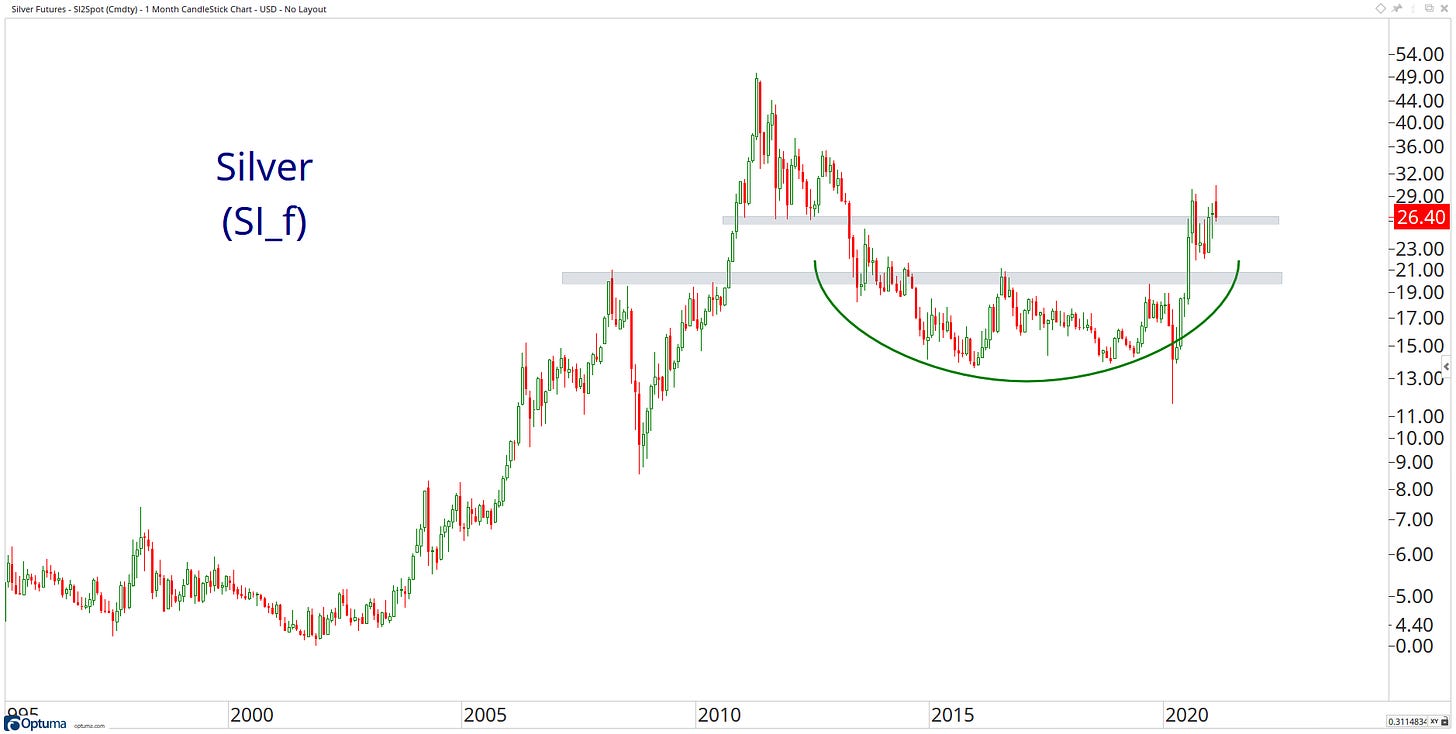
25. Silver Futures - SI2Spot
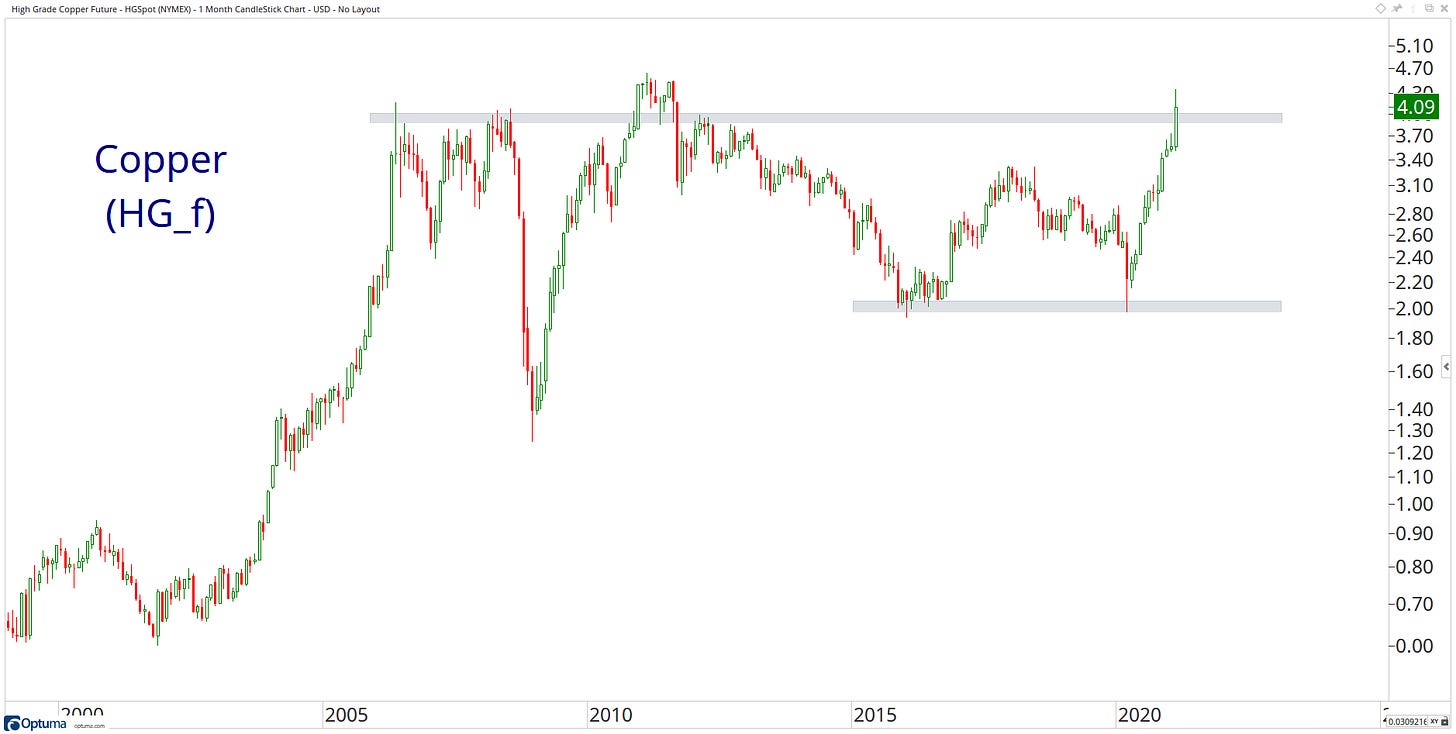
26. High-Grade Copper Future - HGSpot
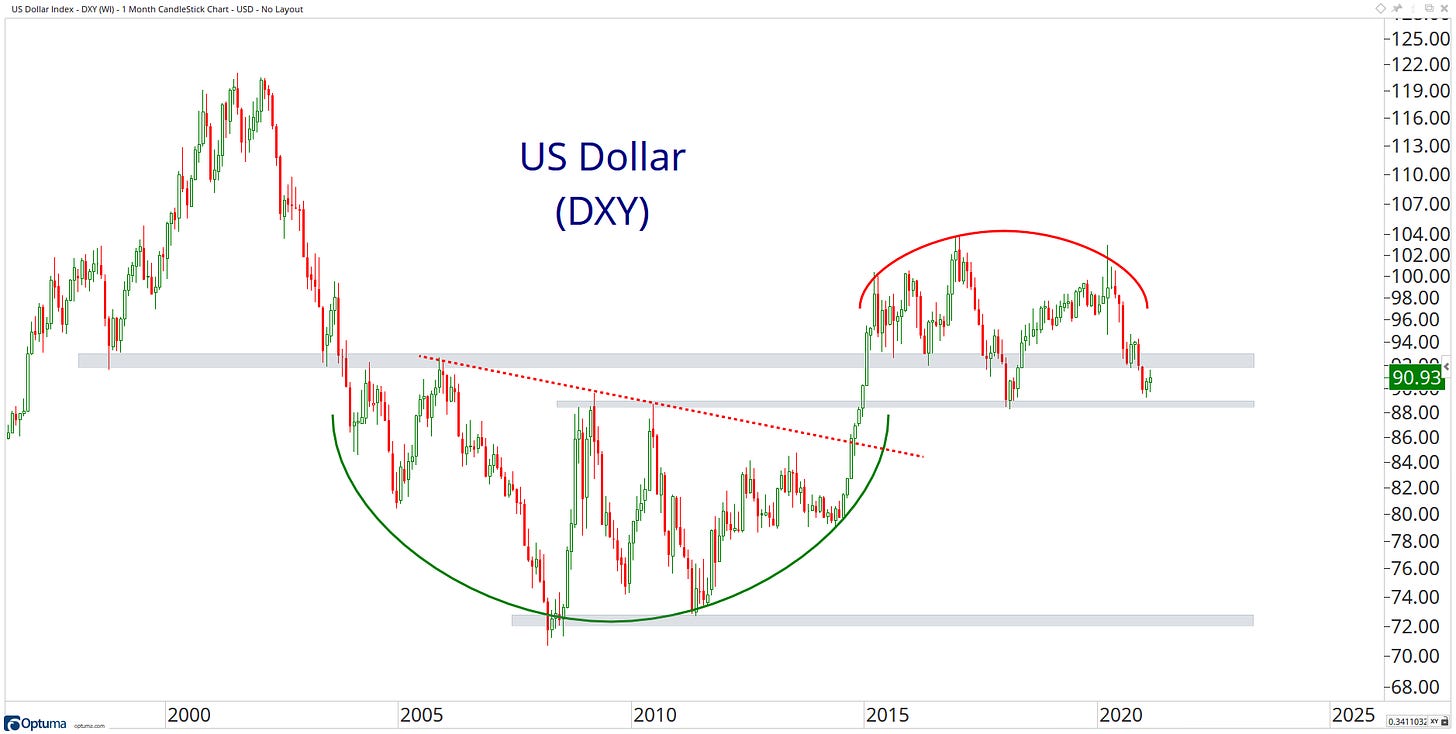
27. US Dollar Index - DXY
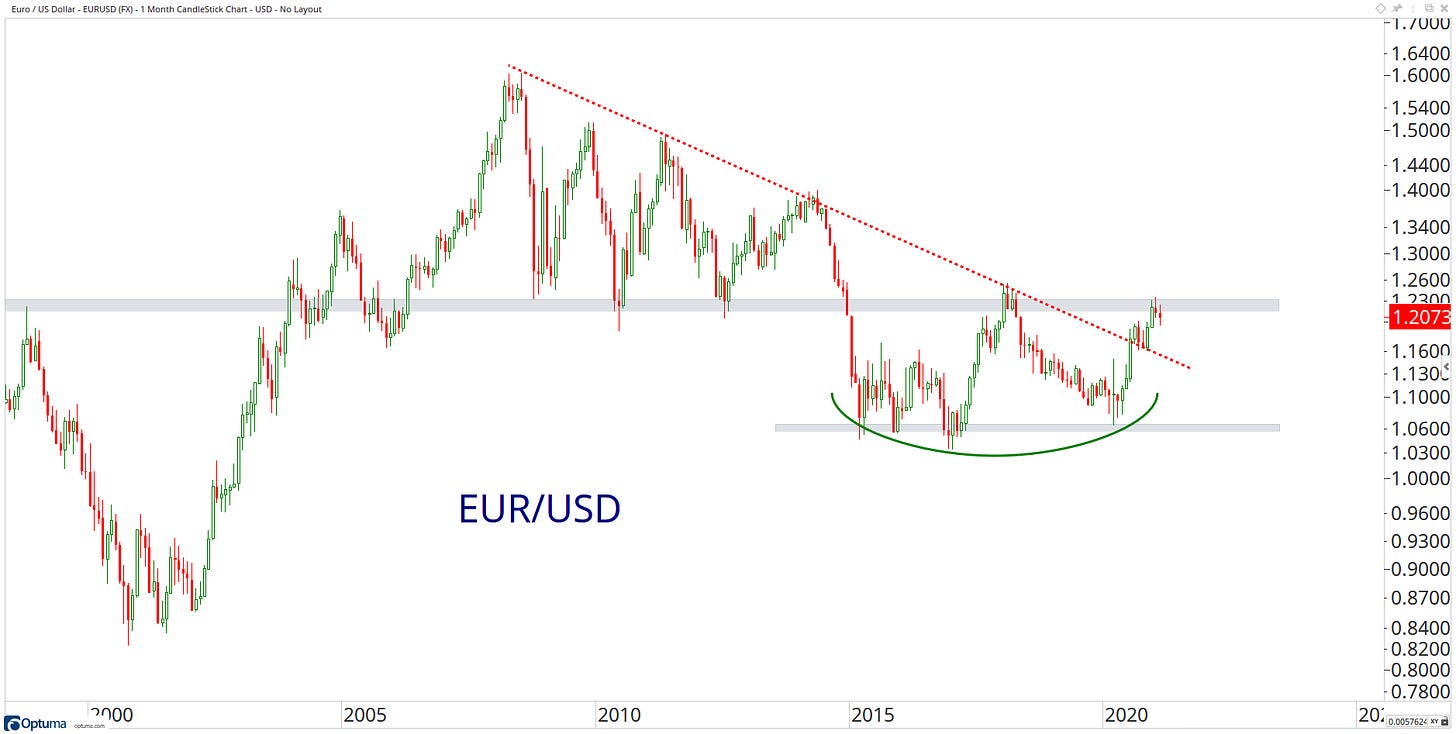
28. Euro / US Dollar - EURUSD
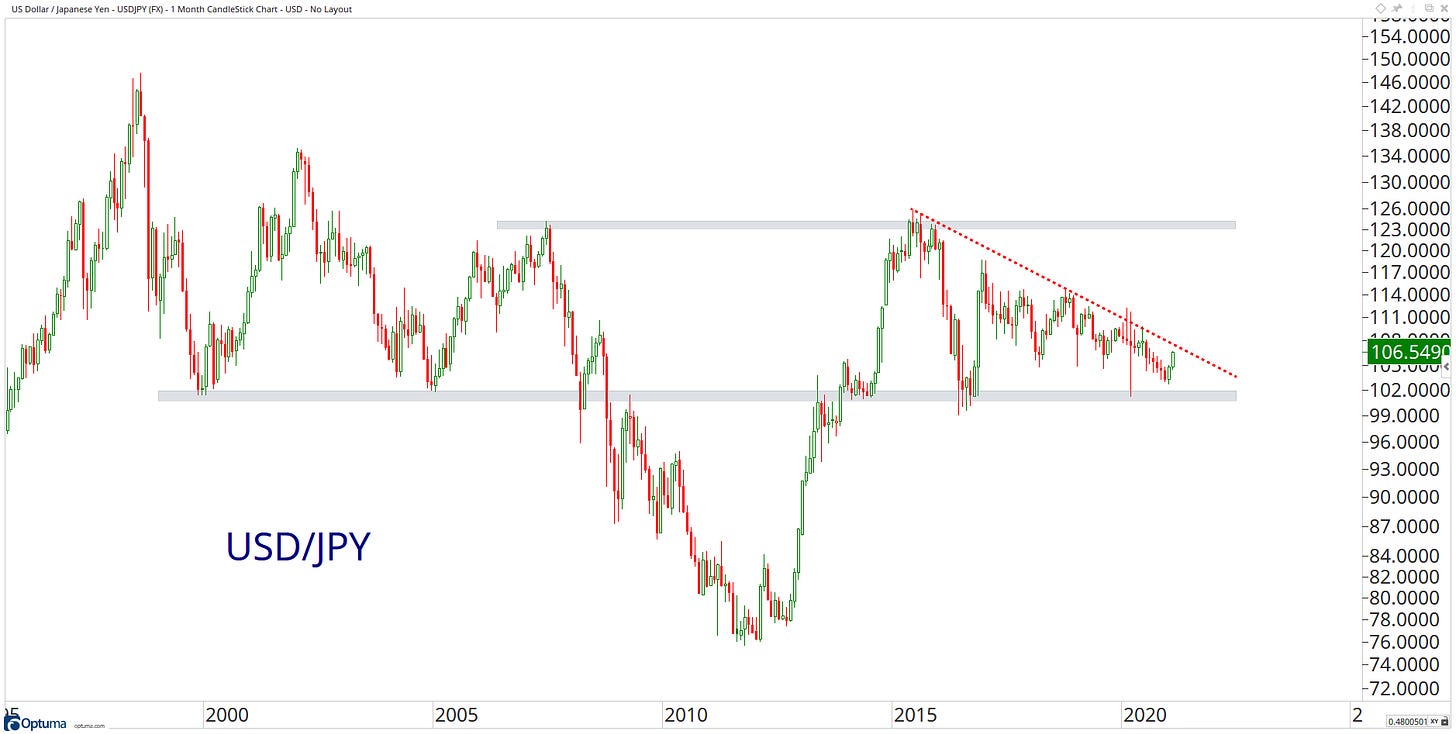
29. US Dollar / Japanese Yen - USDJPY
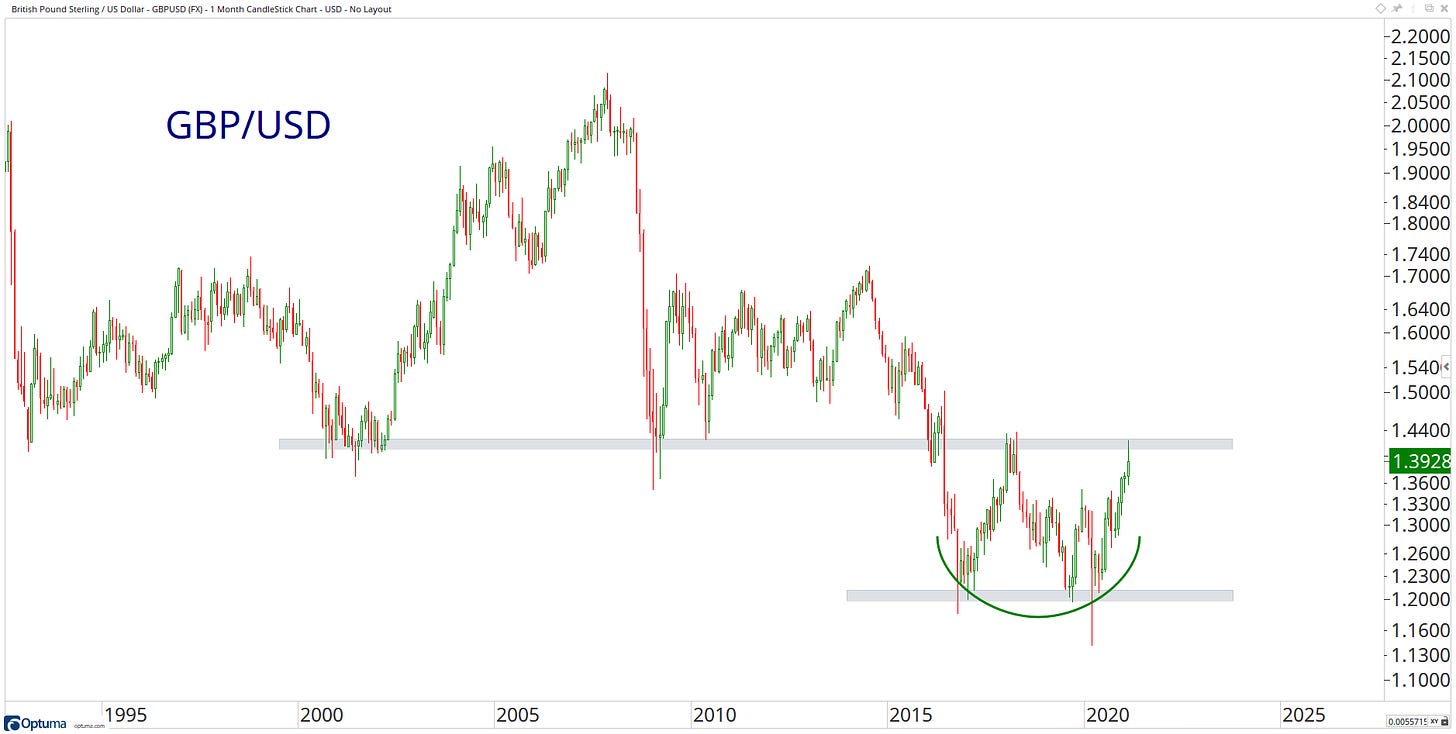
30. British Pound Sterling / US Dollar - GBPUSD
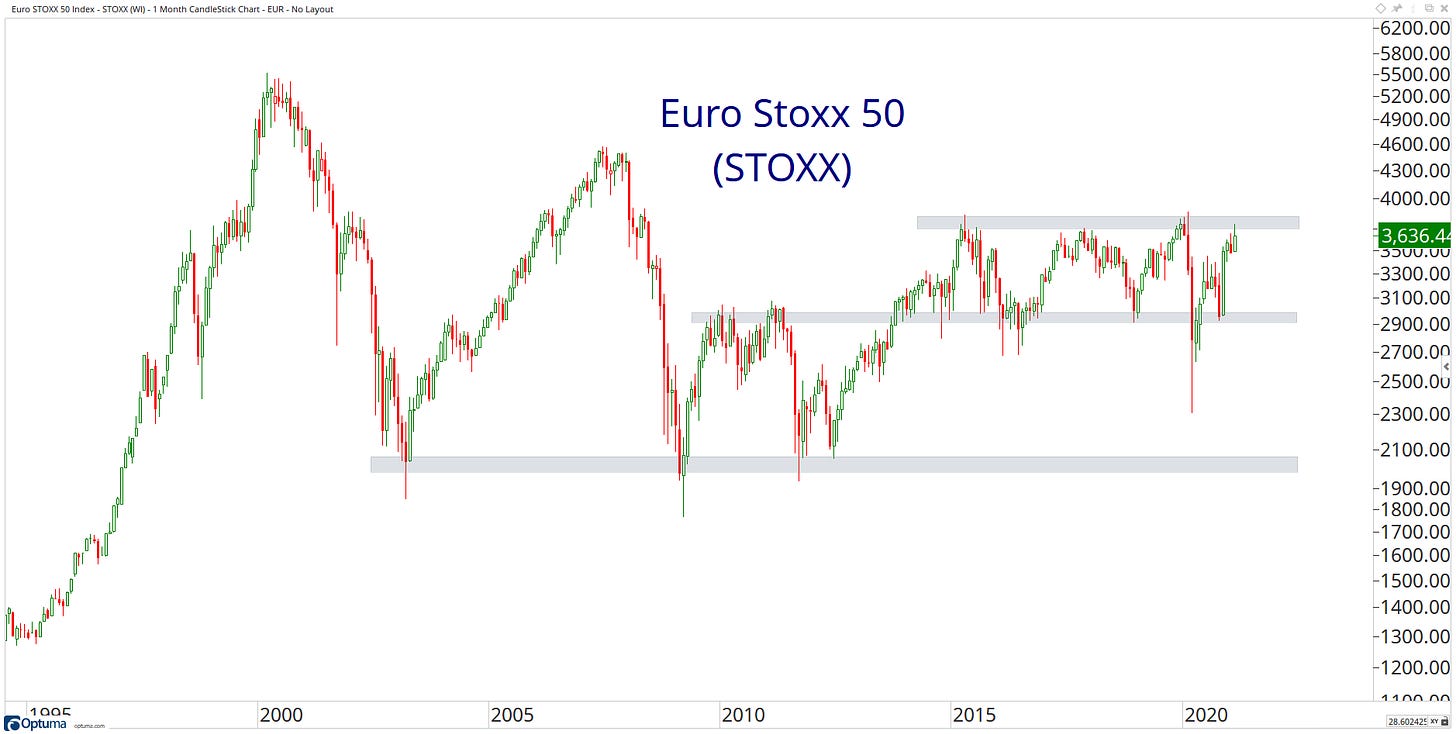
31. Euro STOXX 50 Index - STOXX
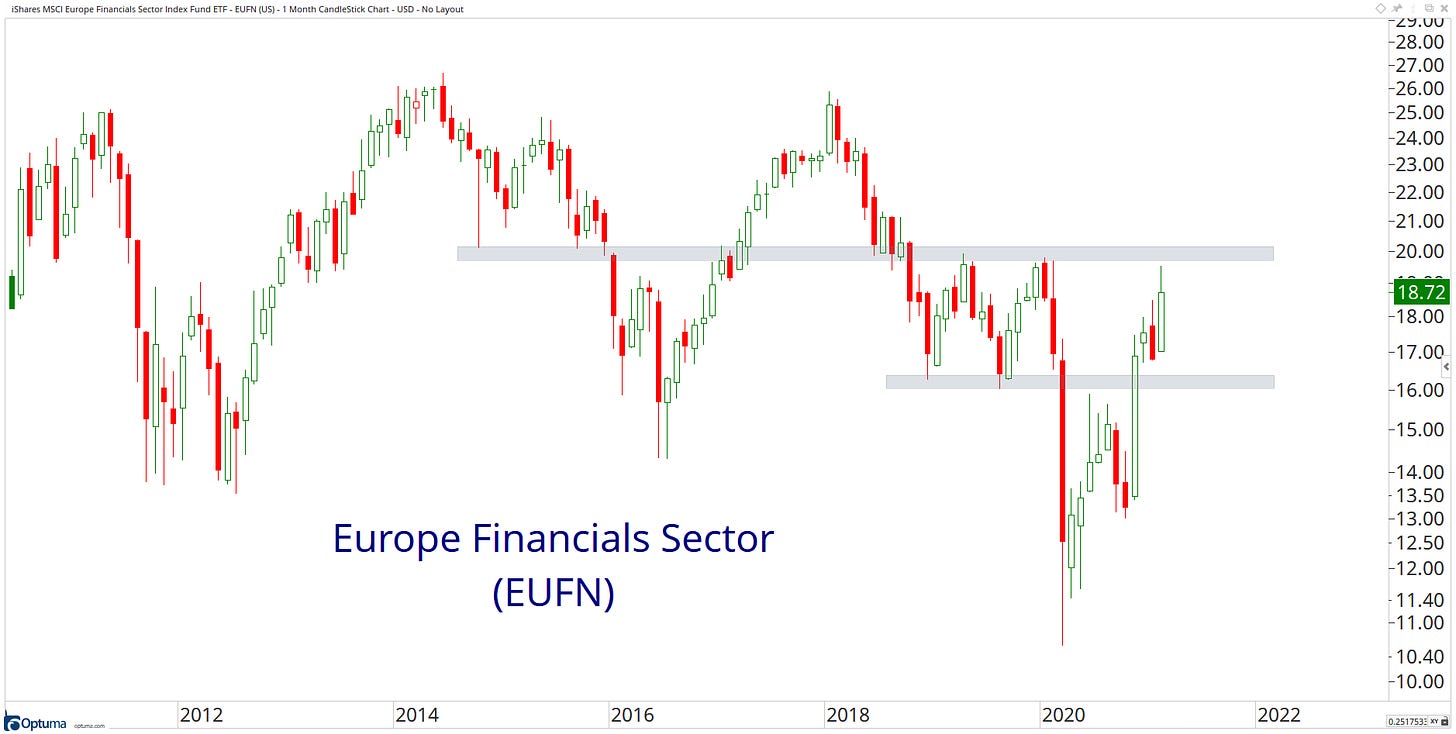
32. iShares MSCI Europe Financials Sector Index Fund ETF - EUFN
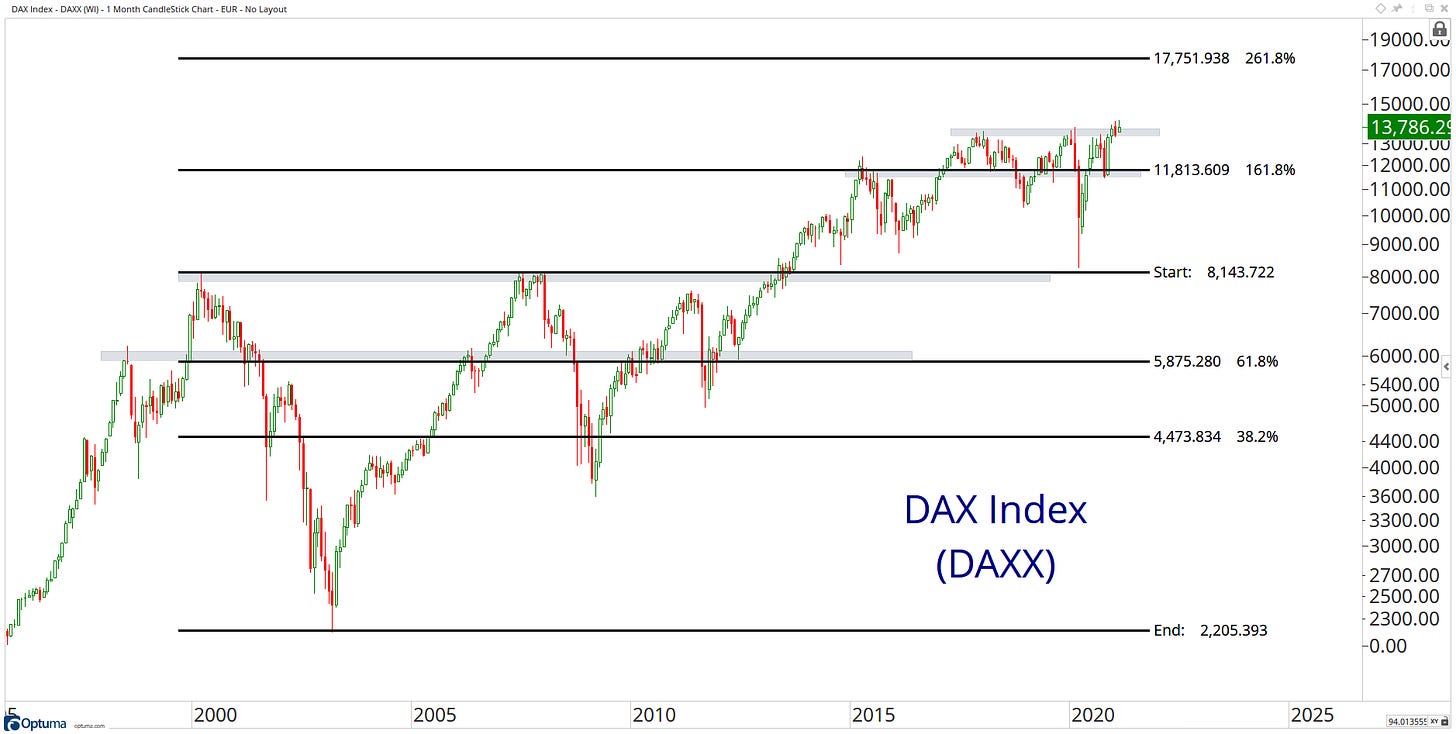
33. DAX Index - DAXX
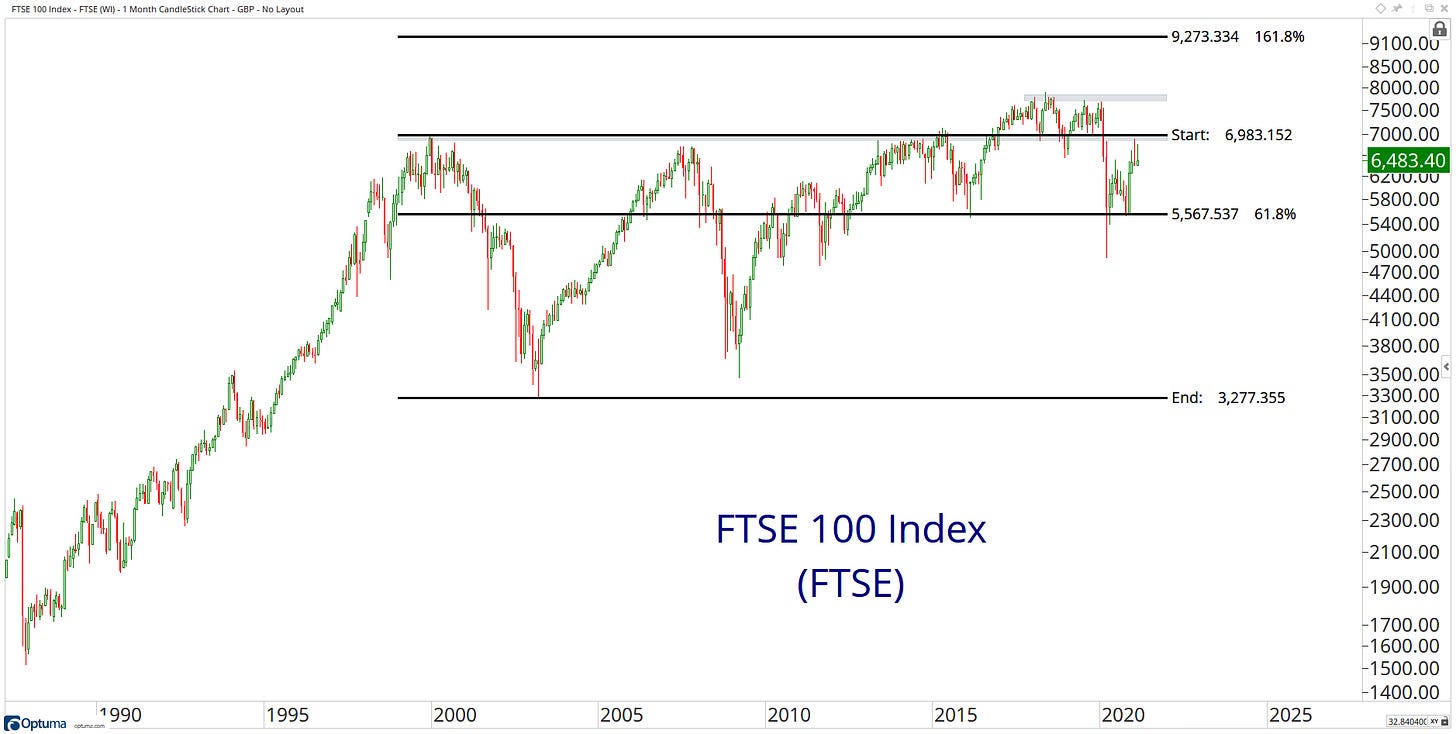
34. FTSE 100 Index - FTSE
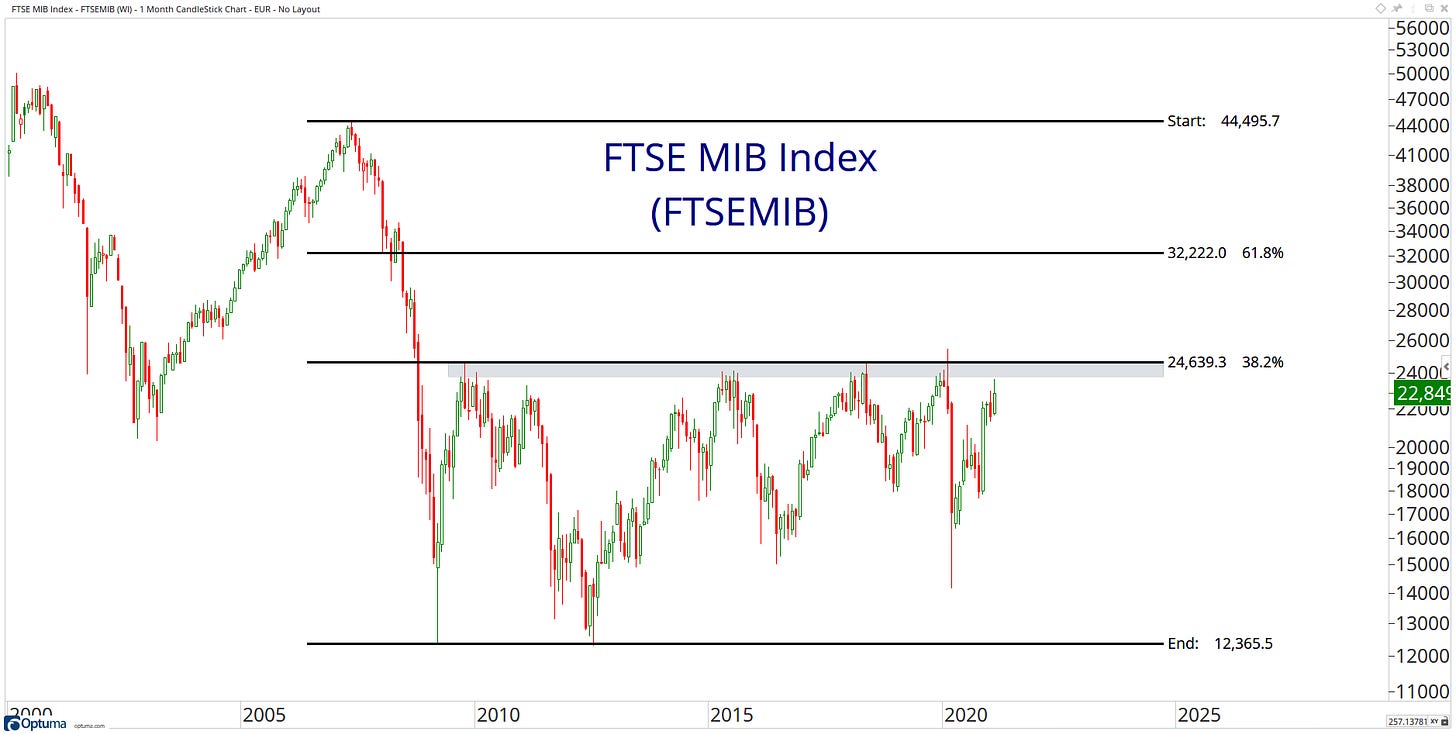
35. FTSE MIB Index - FTSEMIB
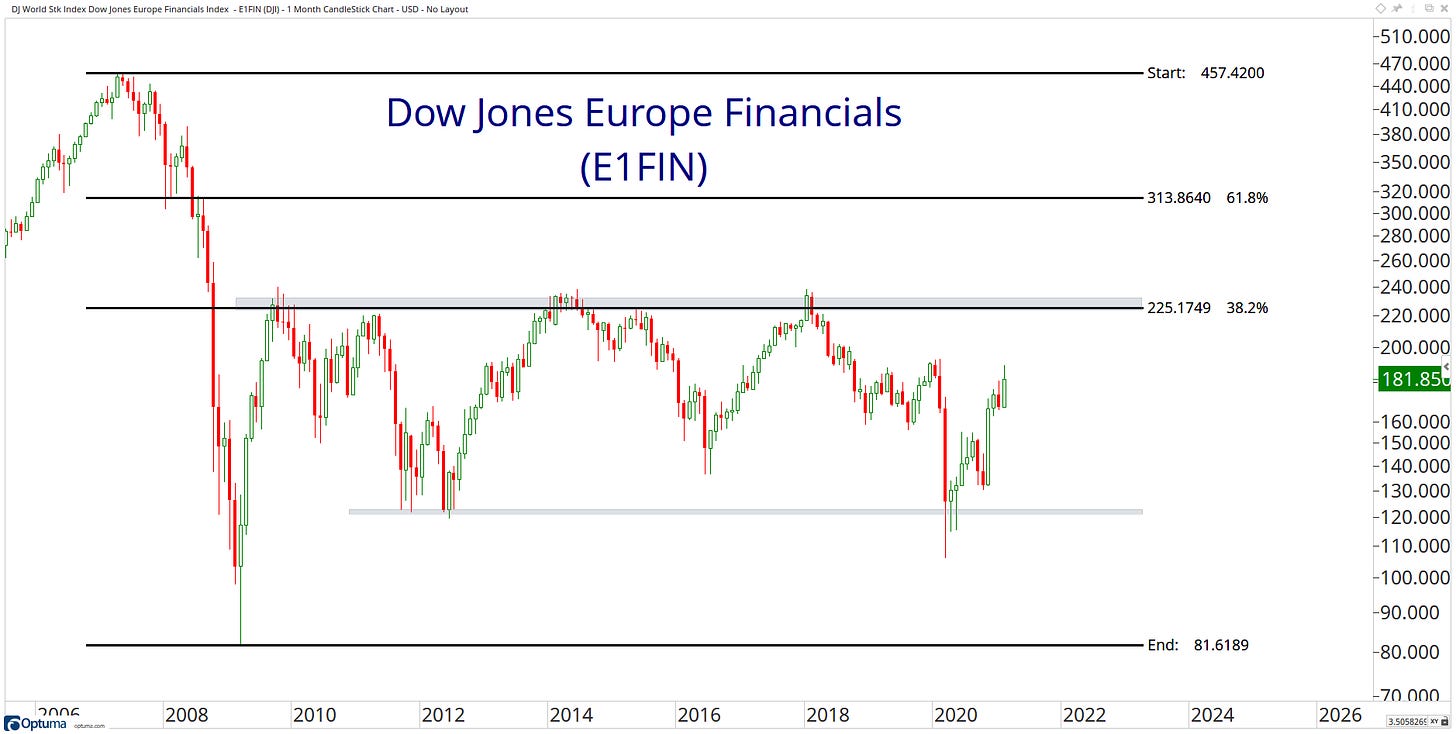
36. DJ World Stock Index Dow Jones Europe Financials Index - E1FIN
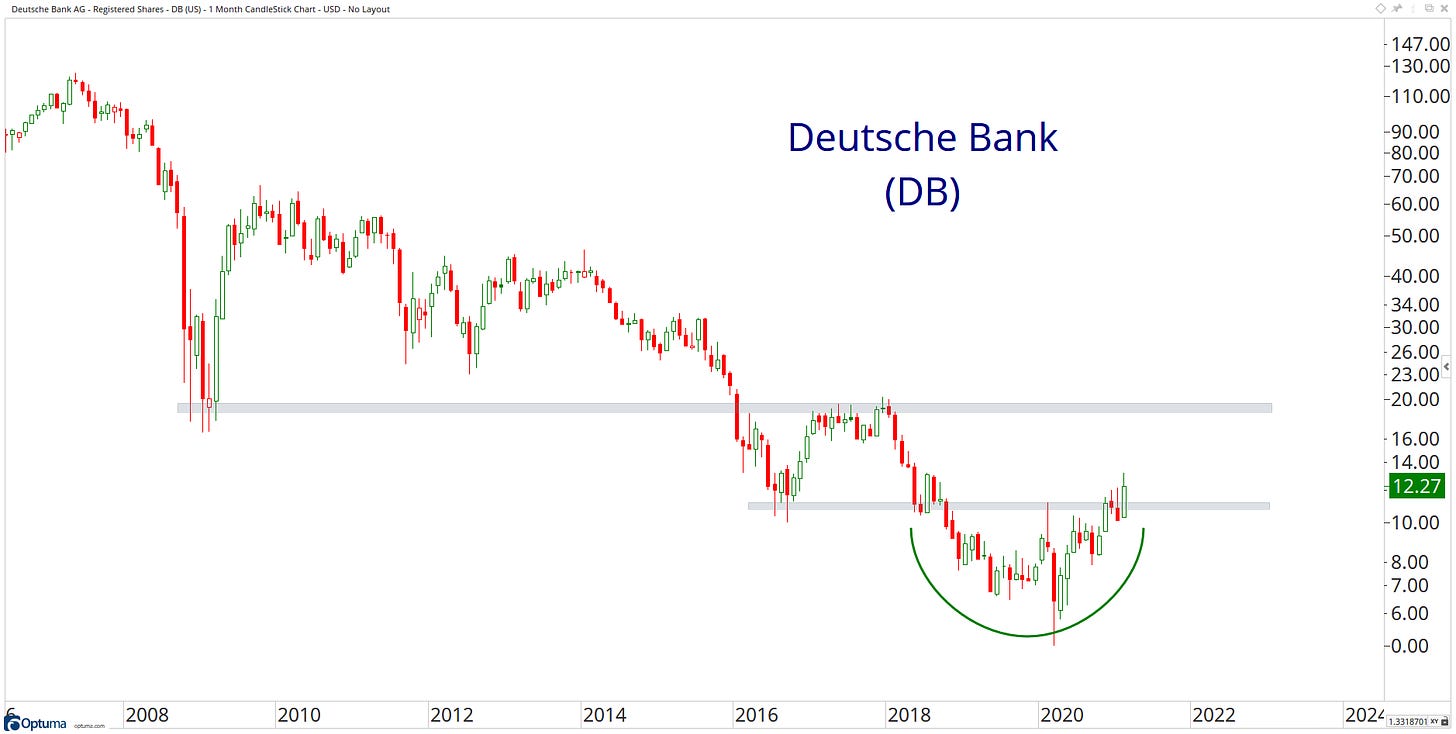
37. Deutsche Bank AG - Registered Shares - DB
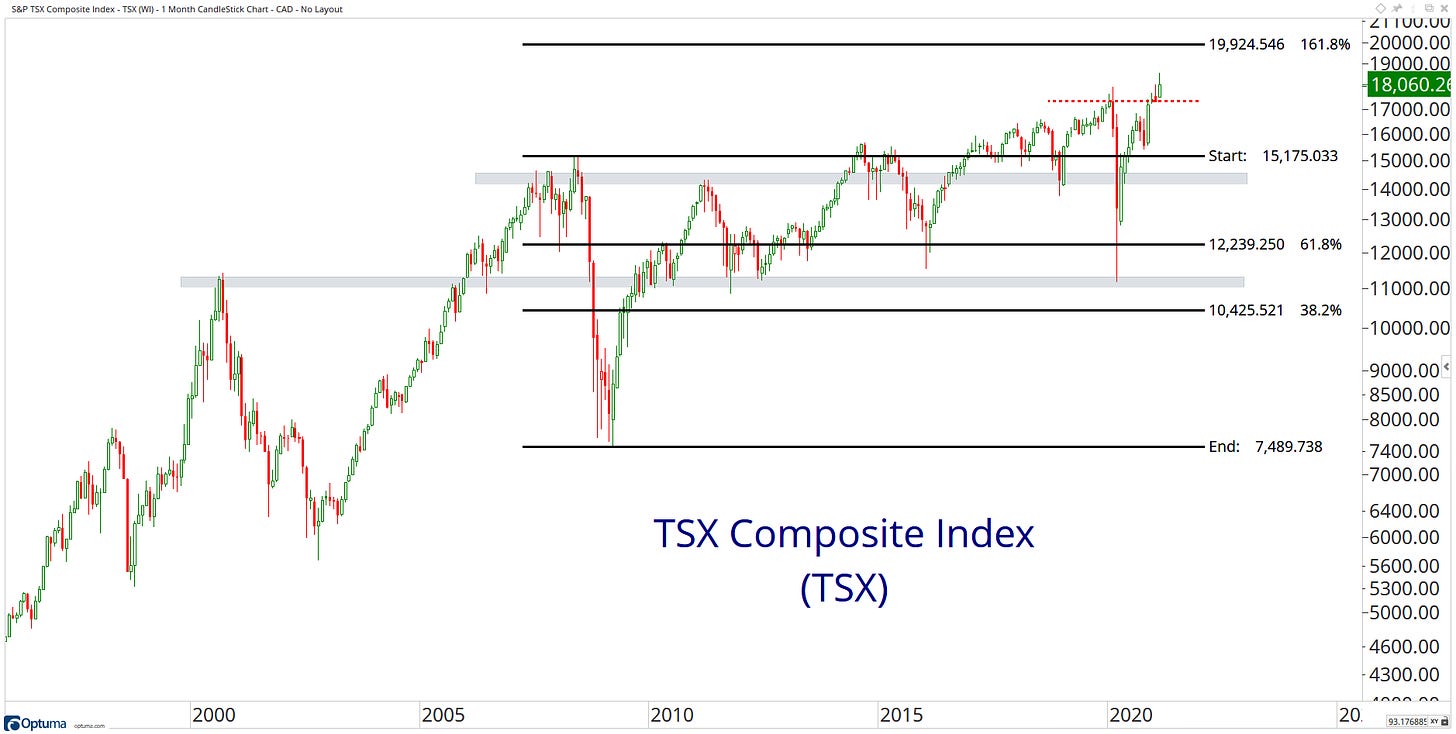
38. S&P TSX Composite Index - TSX
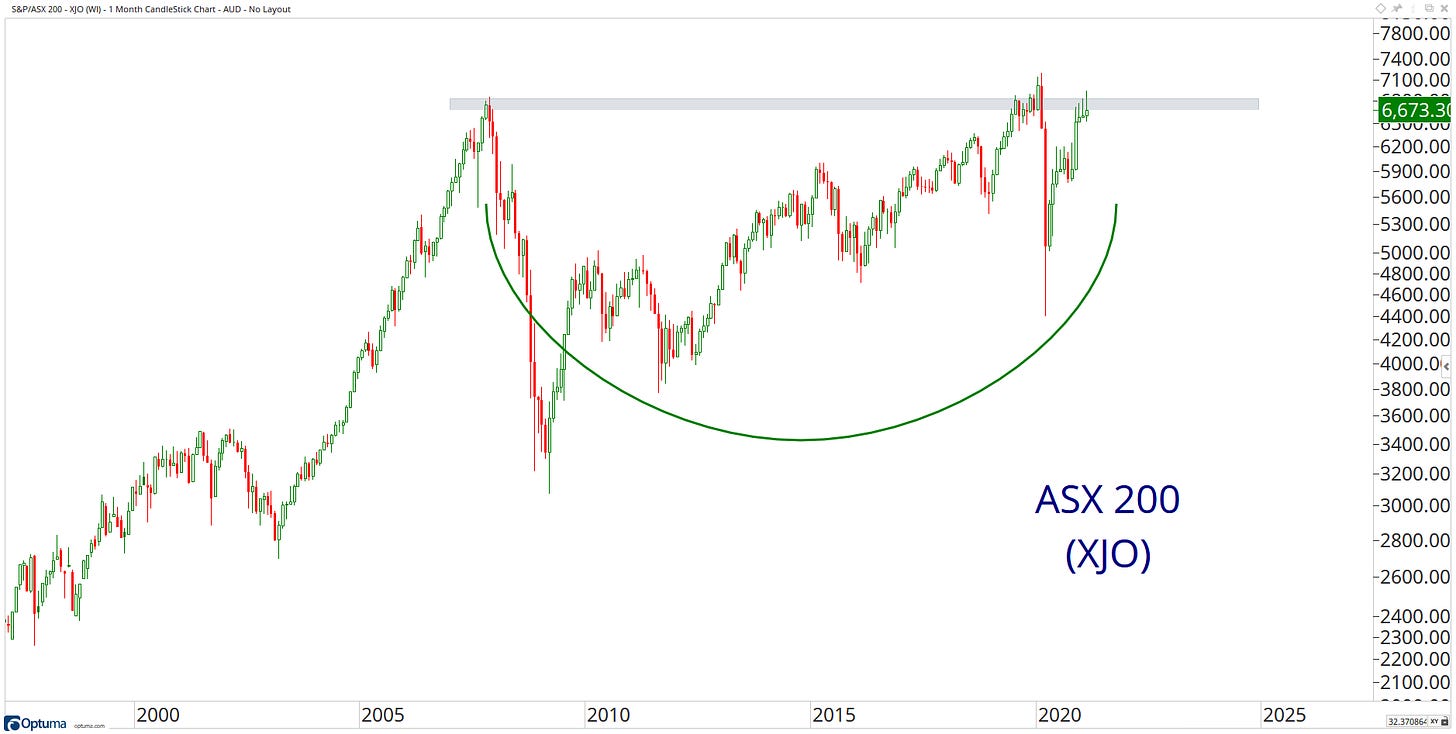
39. S&P/ASX 200 - XJO
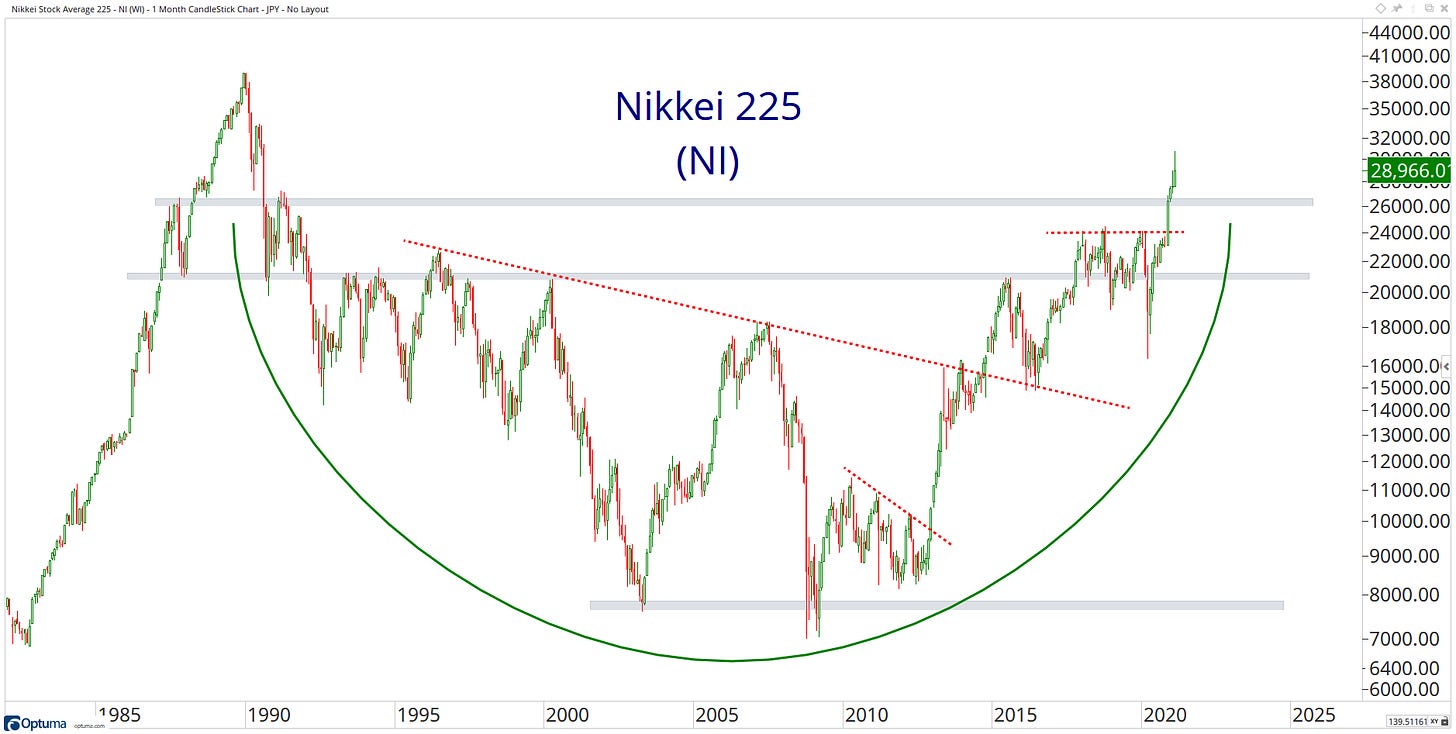
40. Nikkei Stock Average 225 - NI
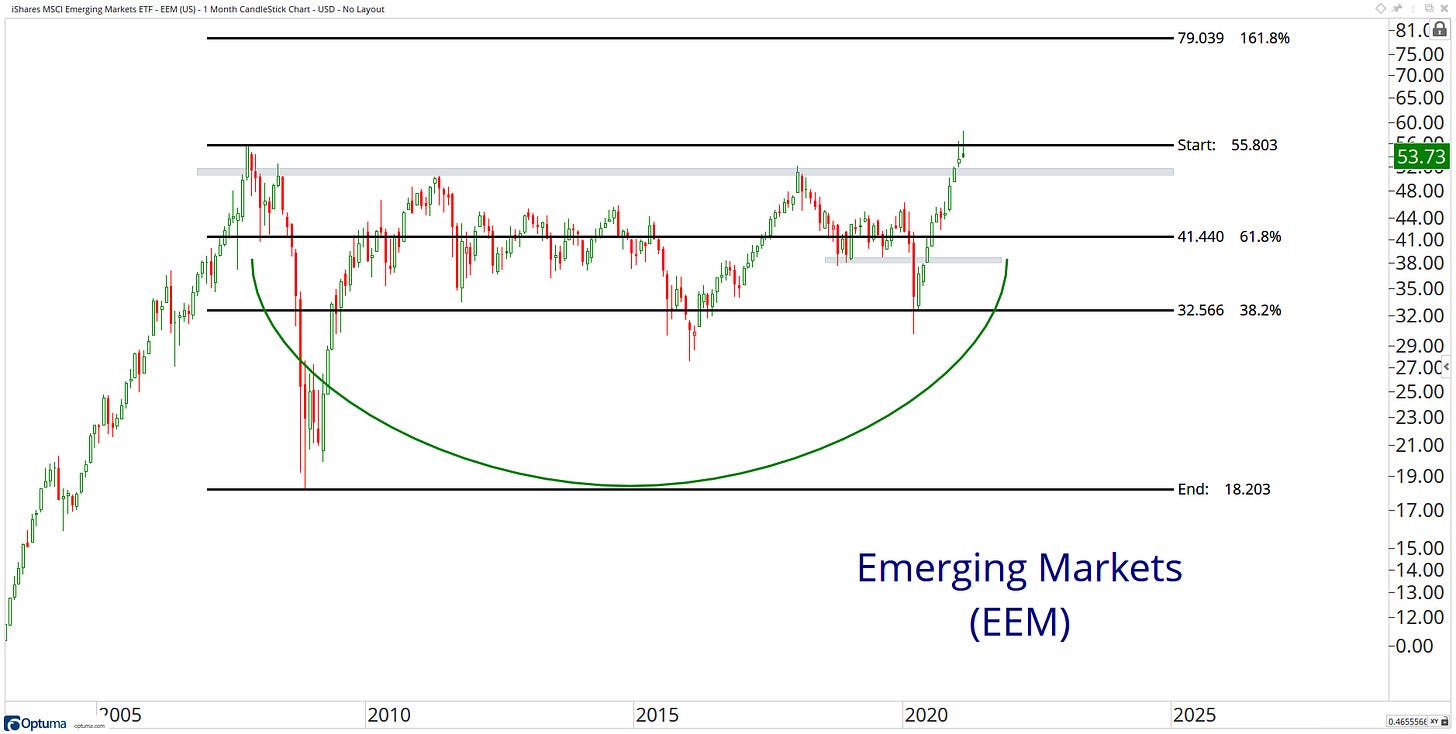
41. iShares MSCI Emerging Markets ETF - EEM
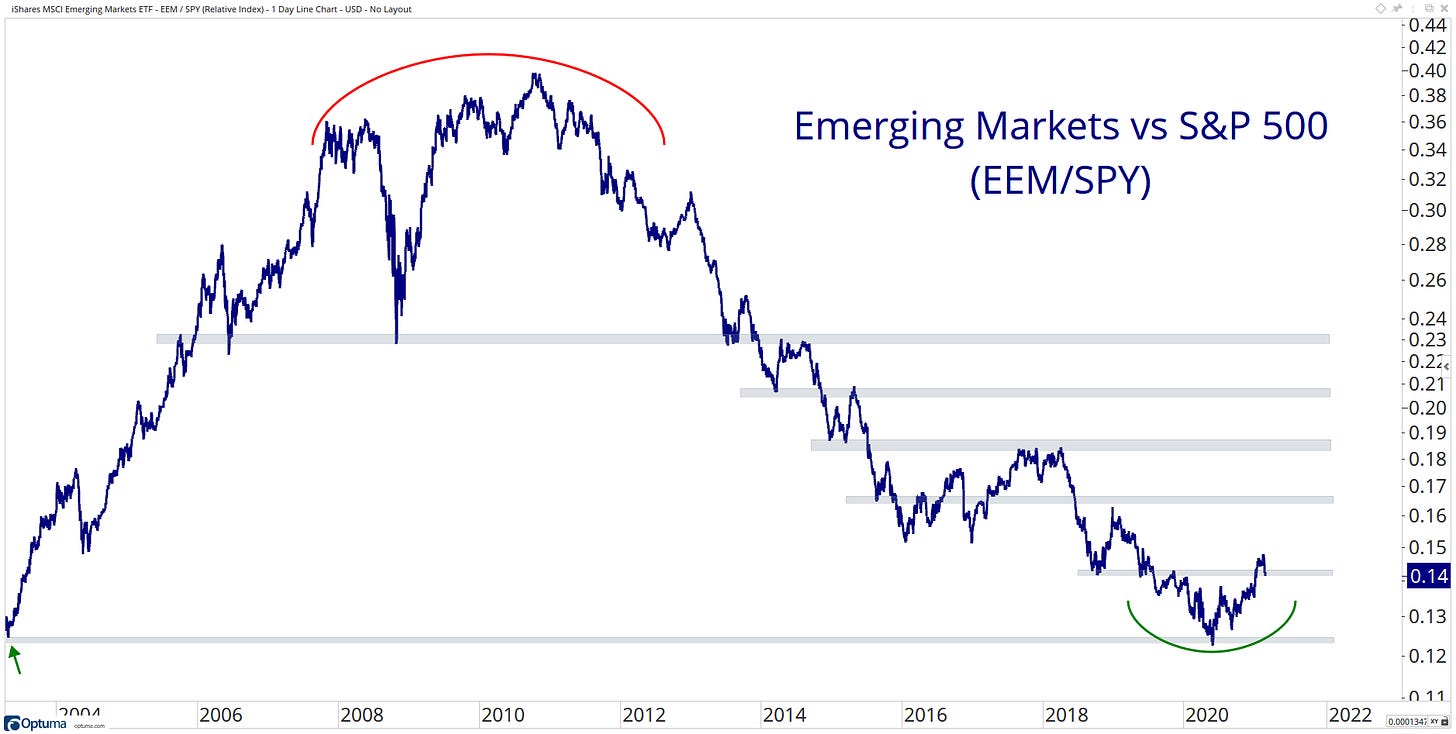
42. EEM / SPY
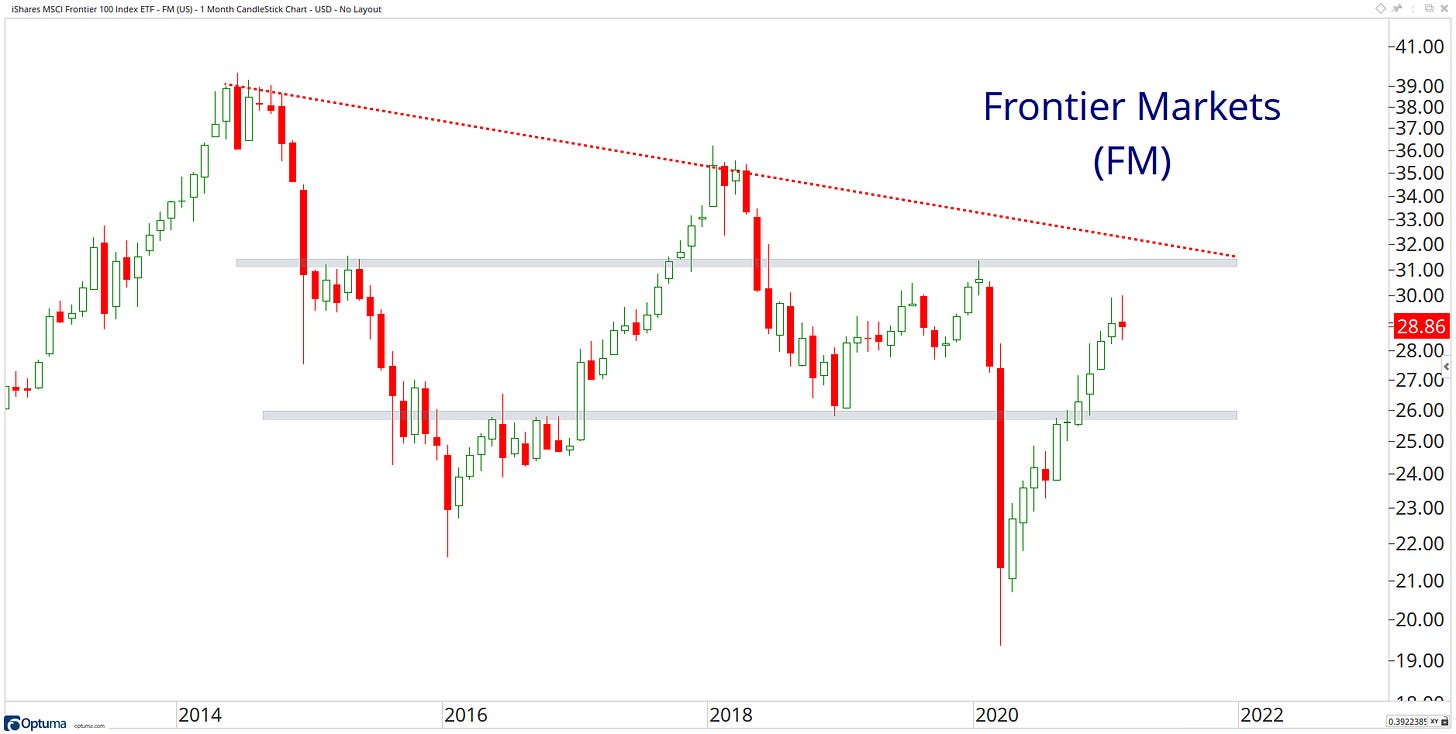
43. iShares MSCI Frontier 100 Index ETF - FM
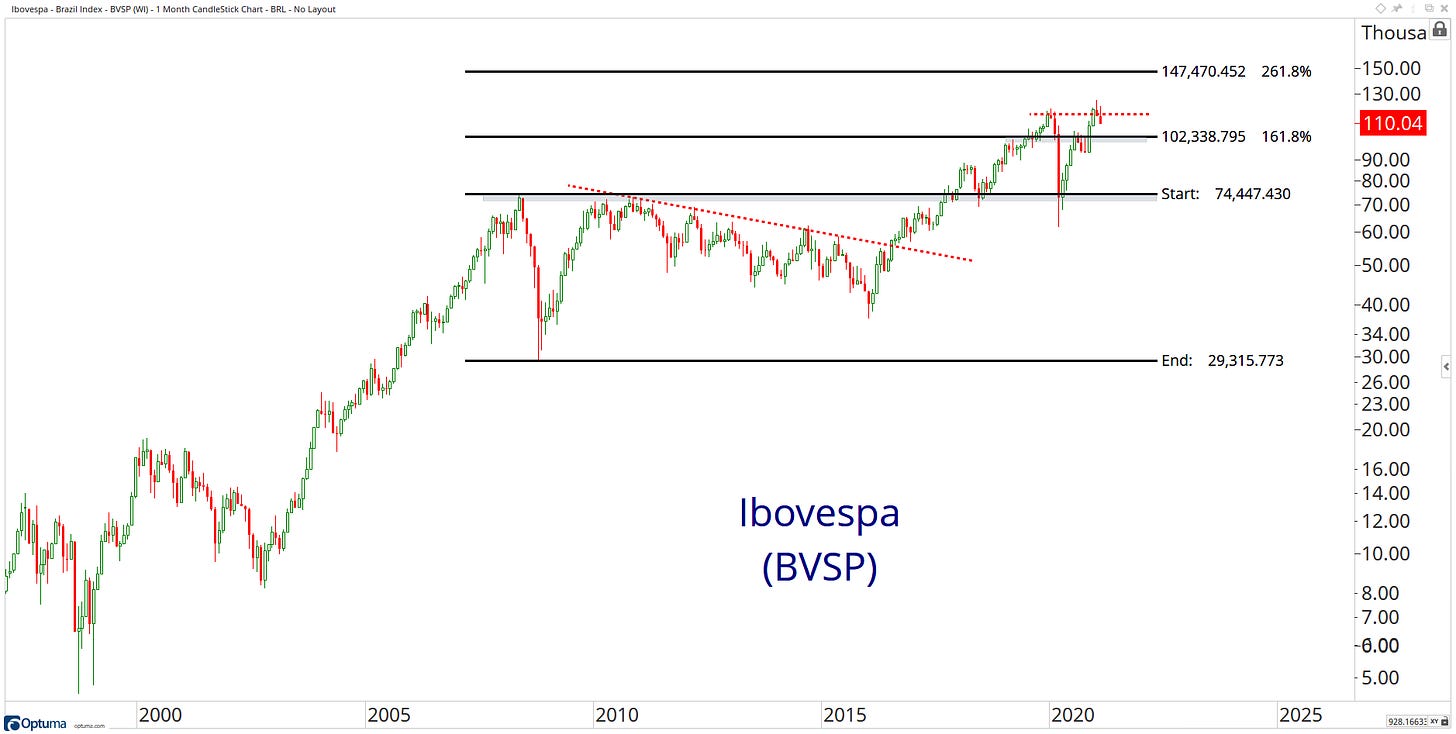
44. Ibovespa - Brazil Index - BVSP
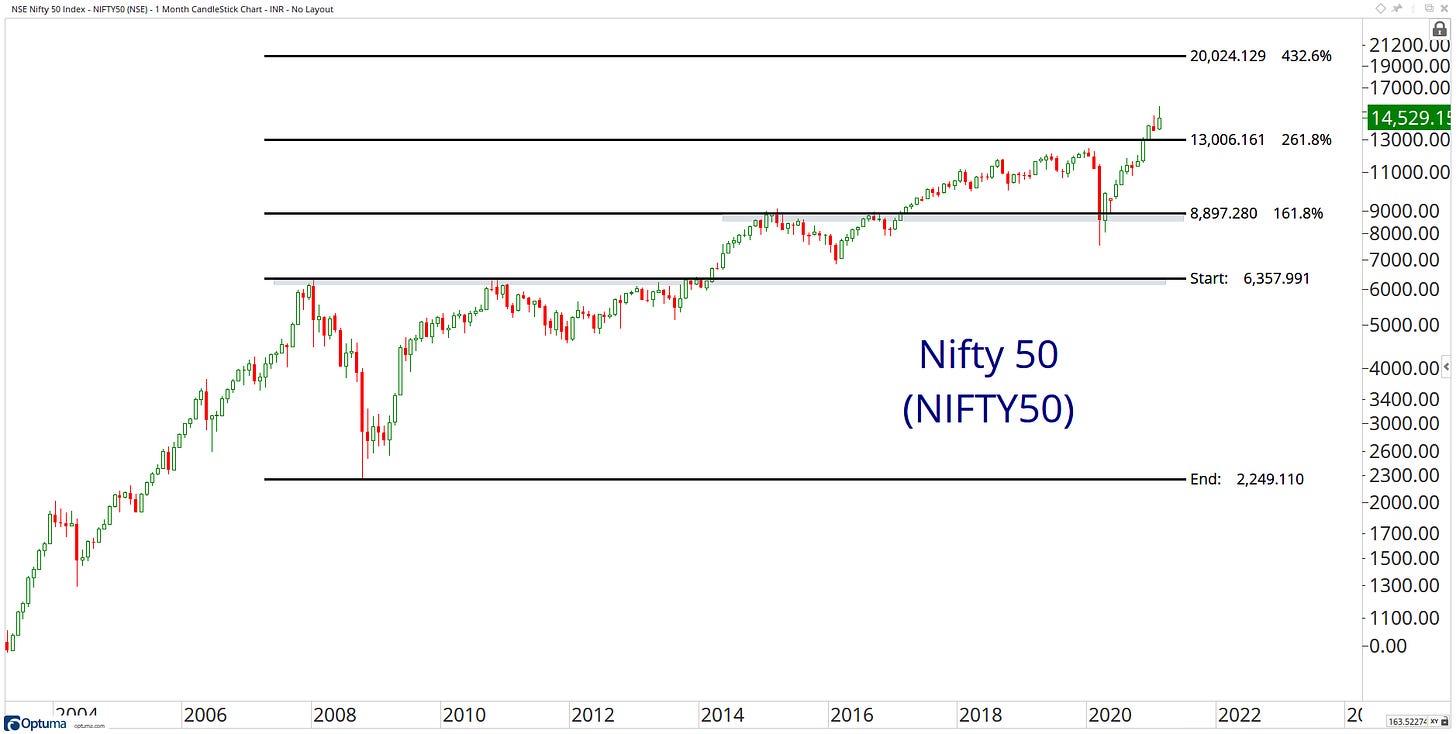
45. NSE Nifty 50 Index - NIFTY50
46. Shanghai Composite Index - SSEC
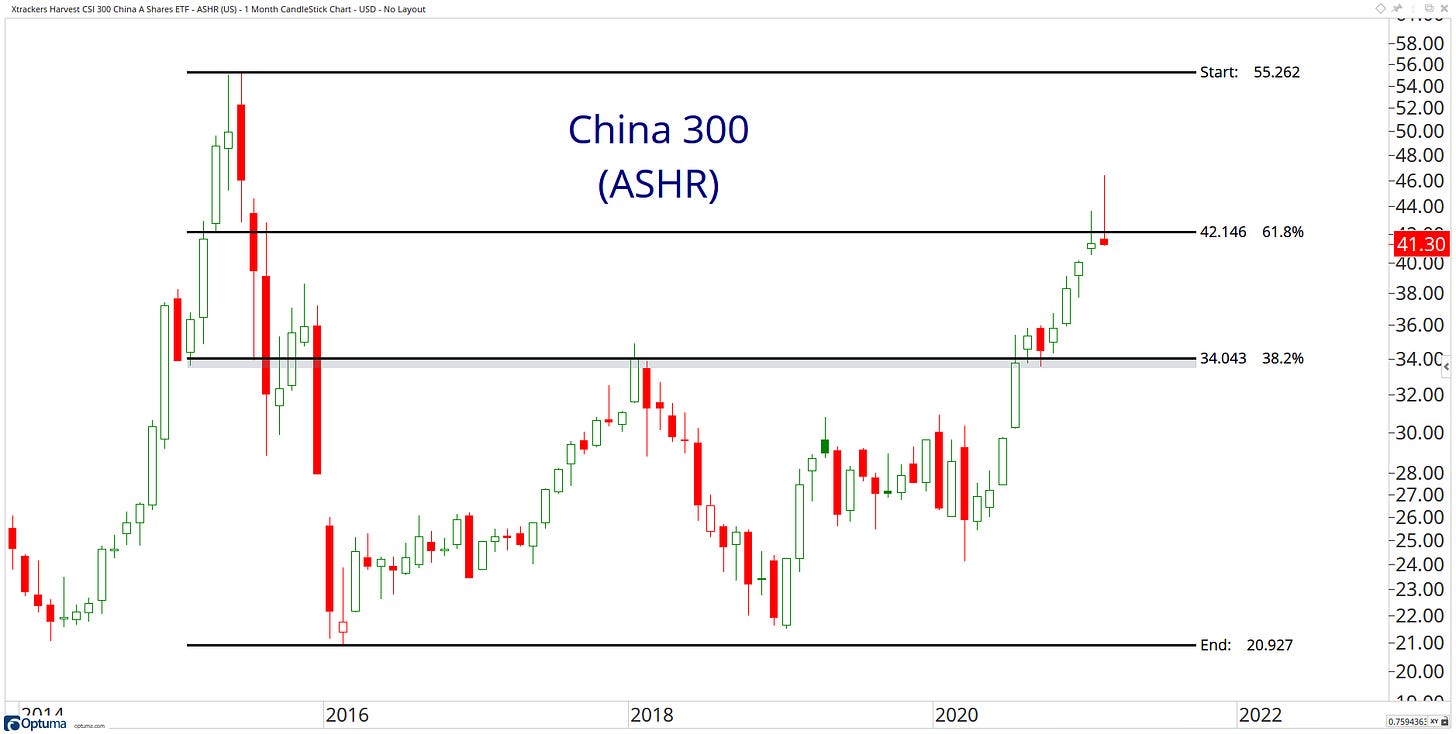
47. Xtrackers Harvest CSI 300 China A-Shares ETF - ASHR
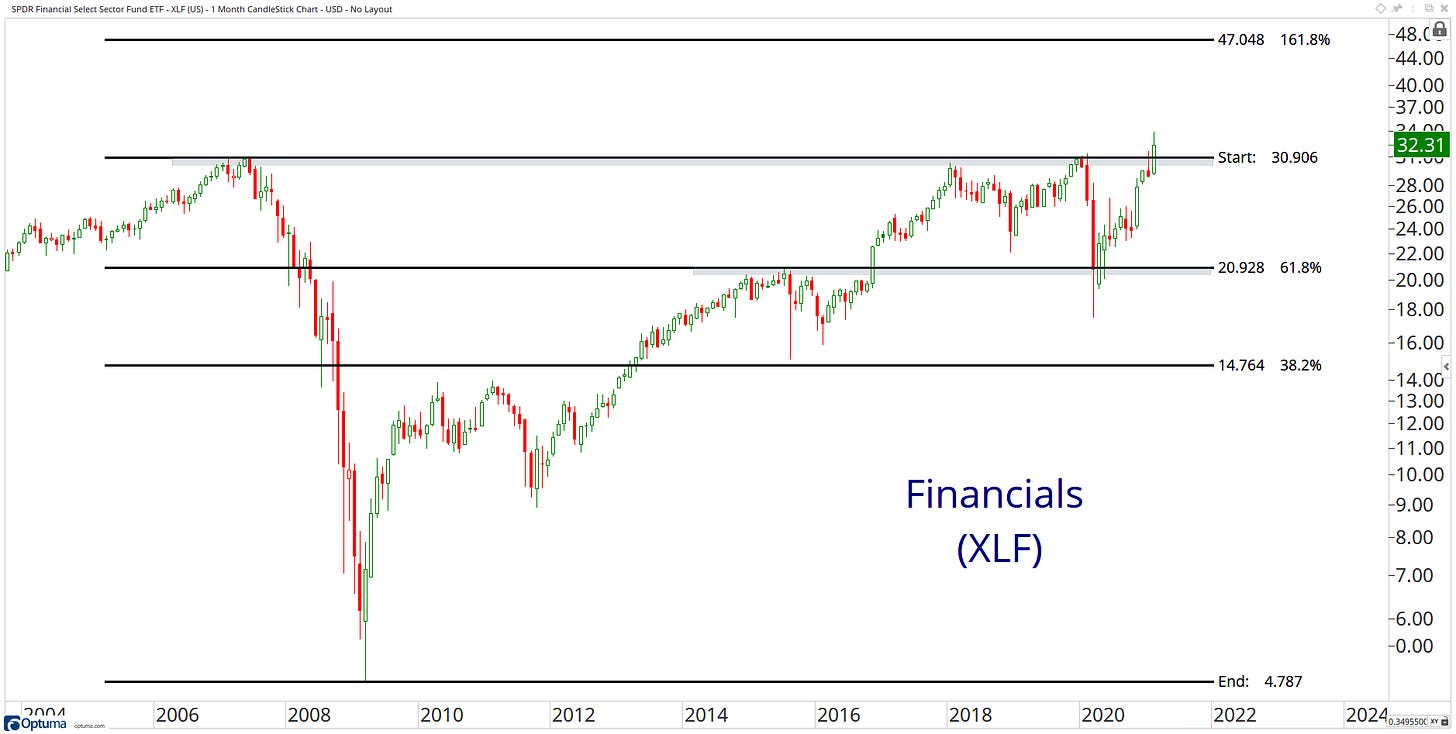
48. SPDR Financial Select Sector Fund ETF - XLF
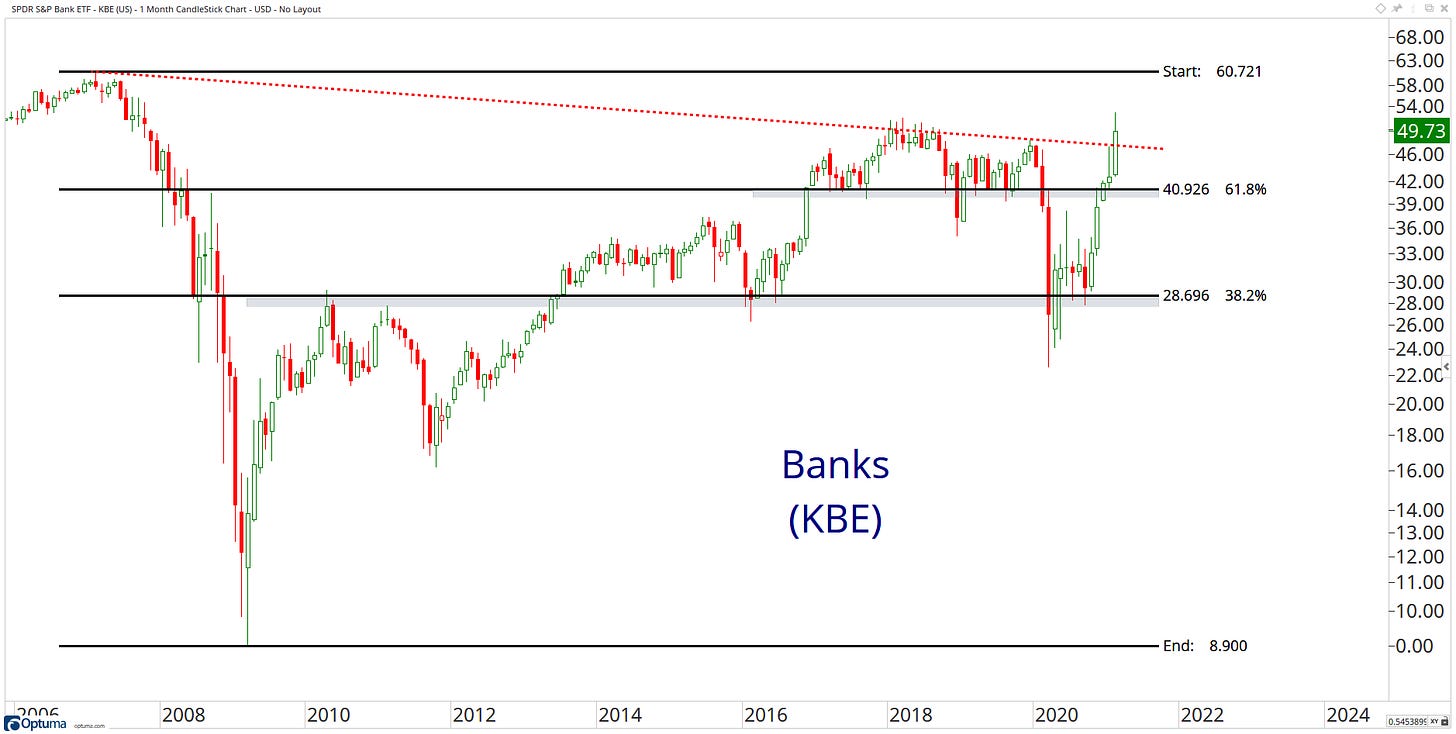
49. SPDR S&P Bank ETF - KBE
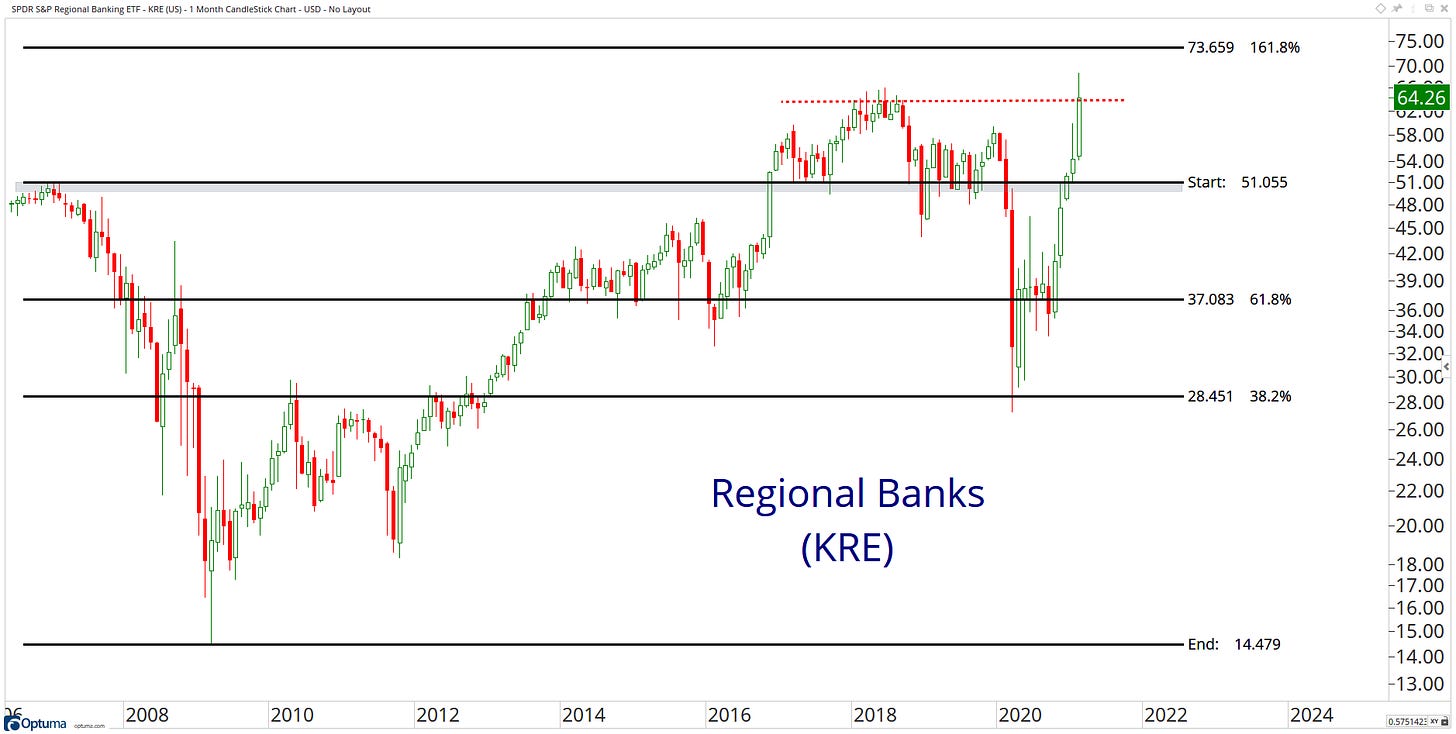
50. SPDR S&P Regional Banking ETF - KRE
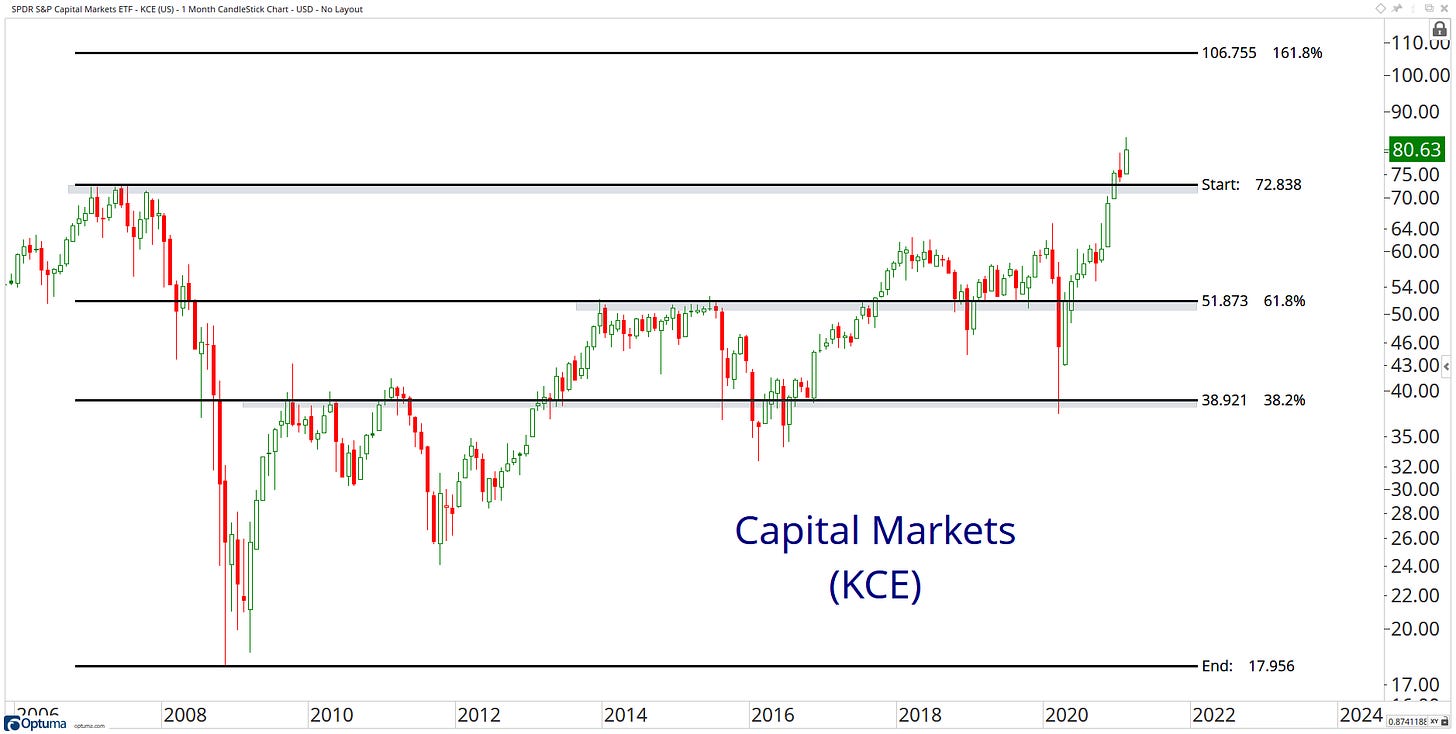
51. SPDR S&P Capital Markets ETF - KCE
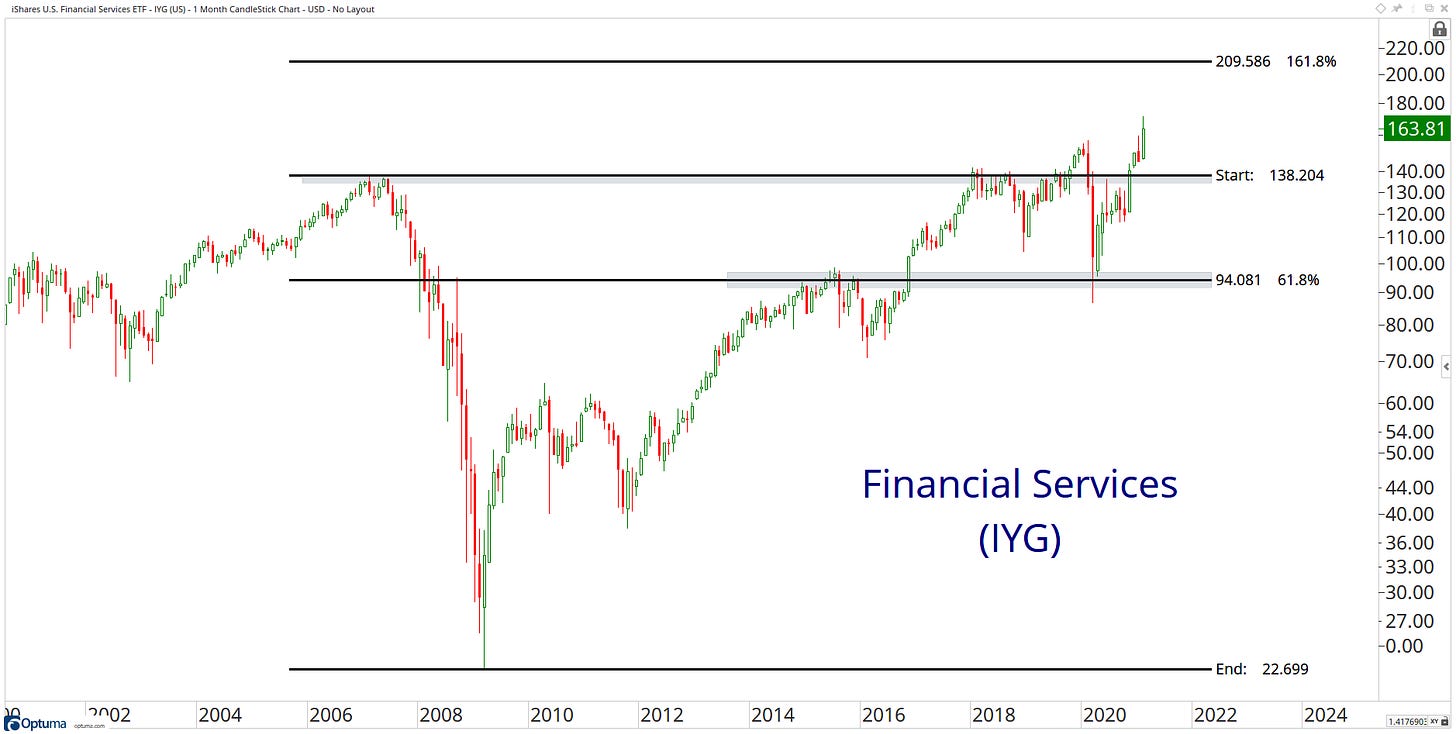
52. iShares U.S. Financial Services ETF - IYG
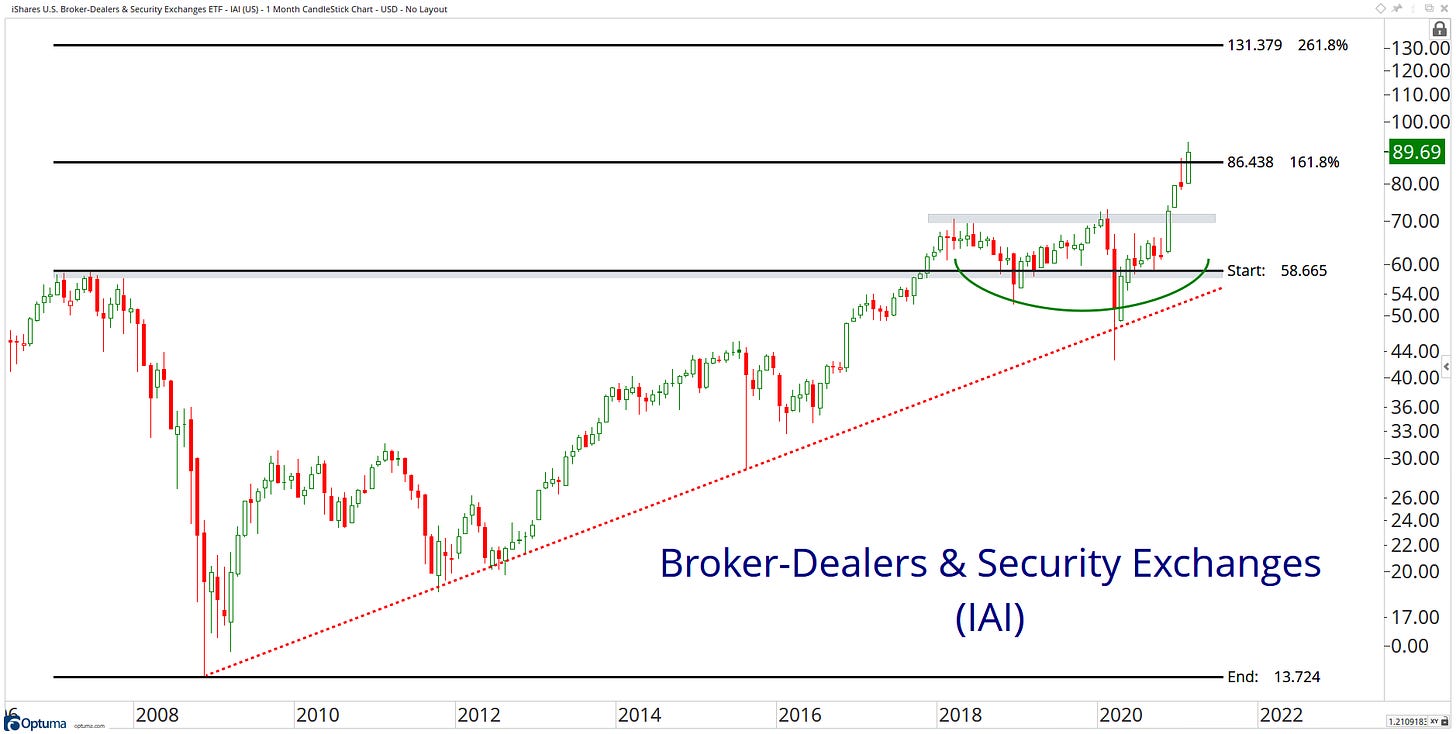
53. iShares U.S. Broker-Dealers & Security Exchanges ETF - IAI
54. SPDR Consumer Discretionary Select Sector Fund ETF - XLY
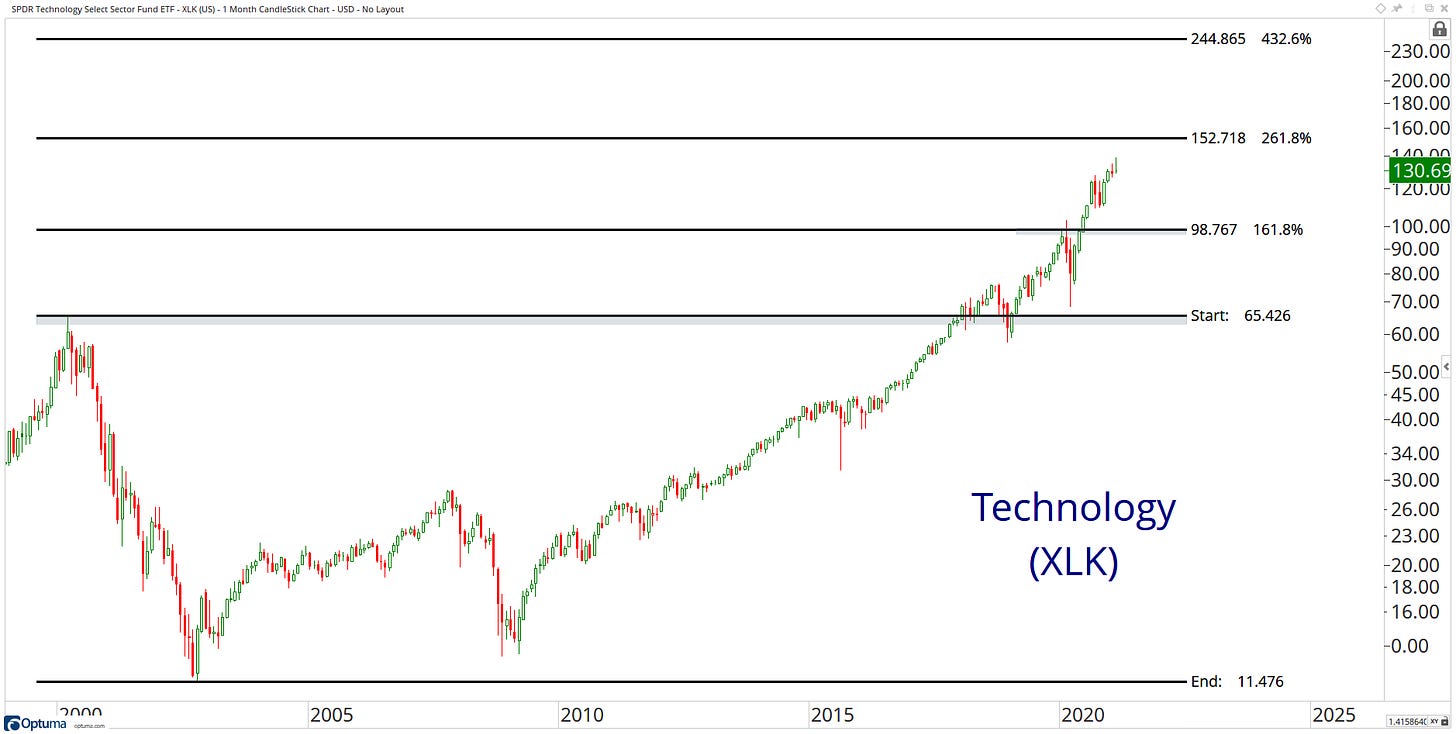
55. SPDR Technology Select Sector Fund ETF - XLK
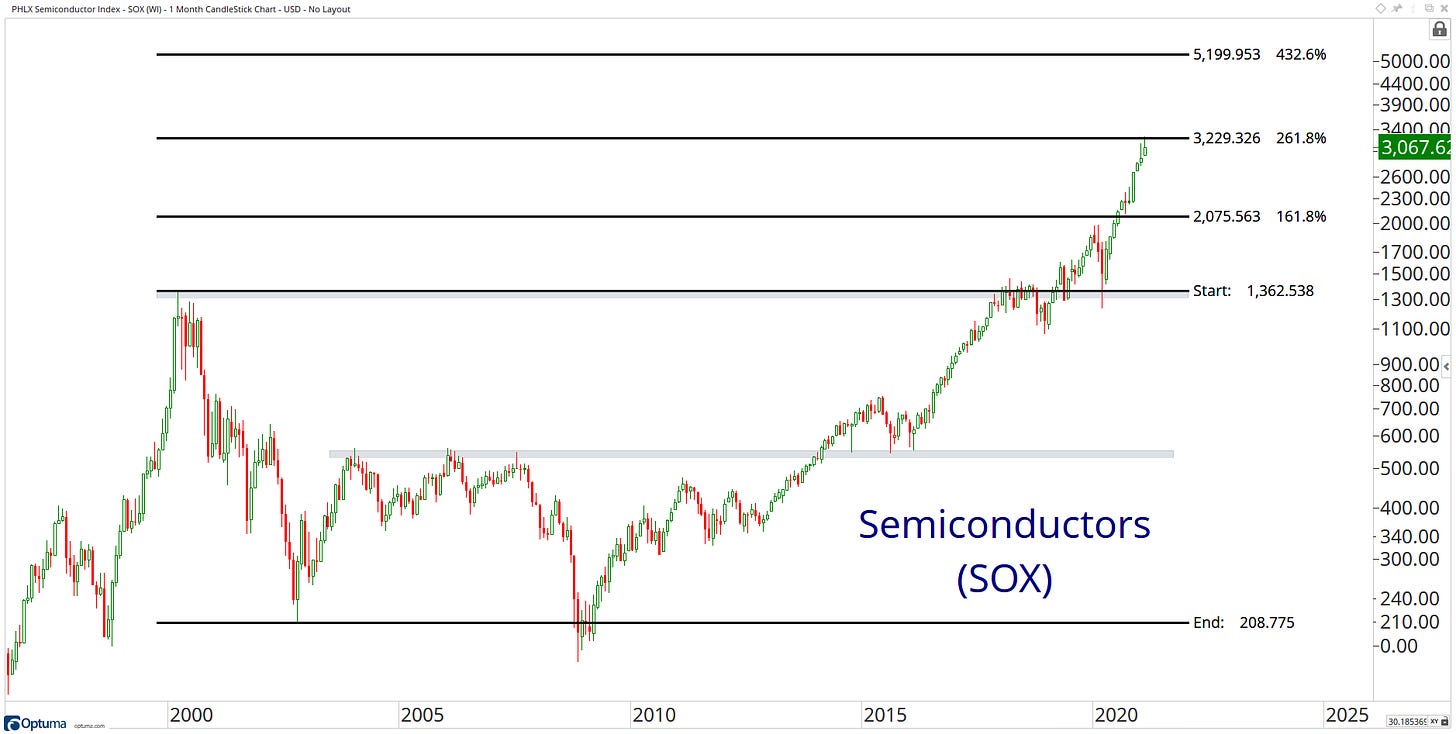
56. PHLX Semiconductor Index - SOX
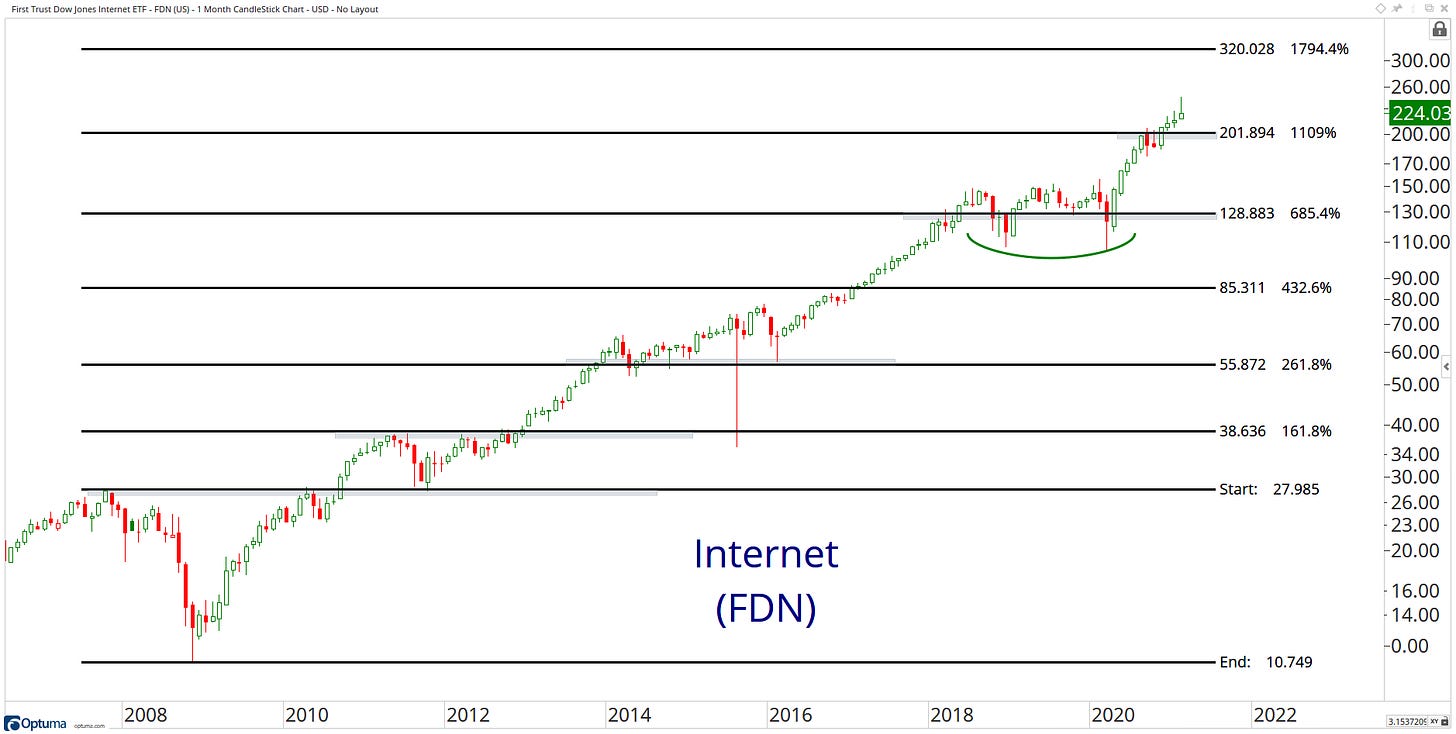
57. First Trust Dow Jones Internet ETF - FDN
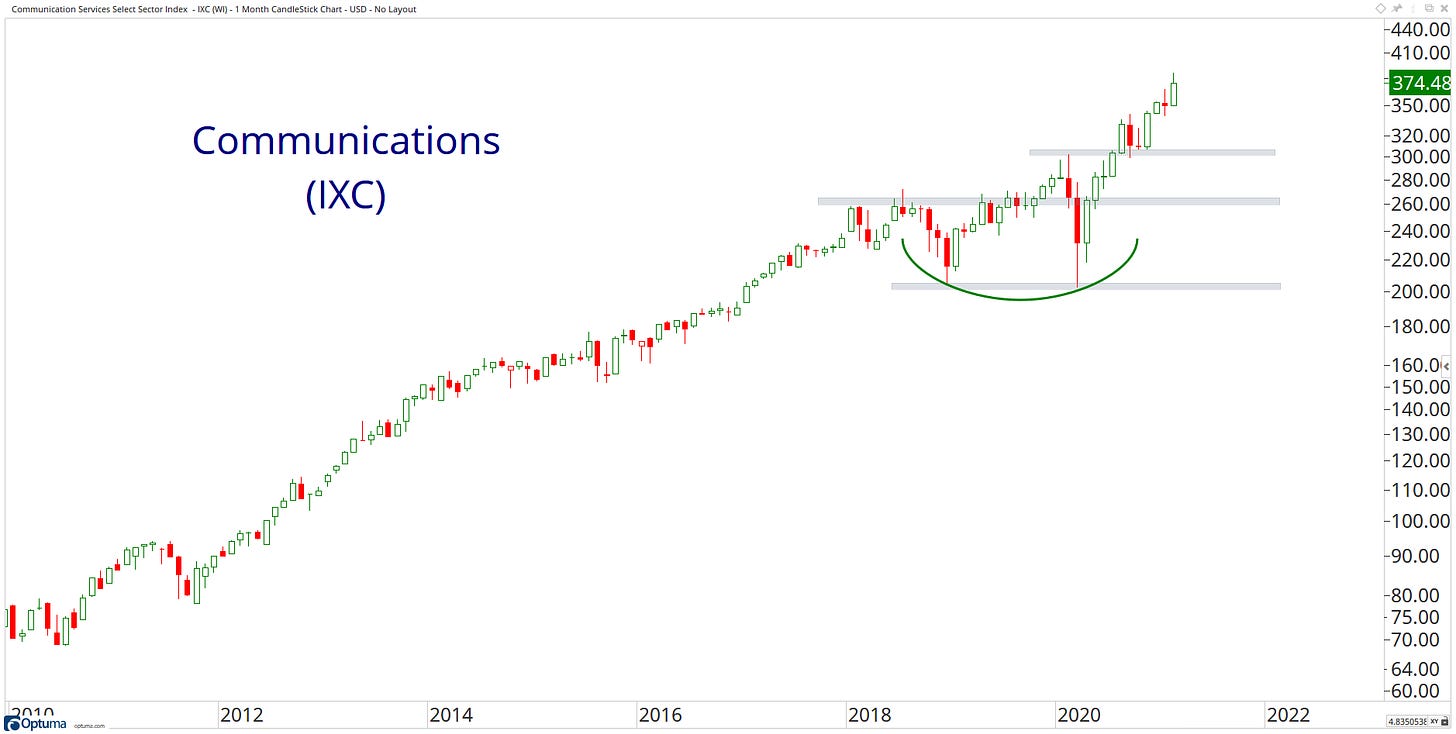
58. Communication Services Select Sector Index - IXC
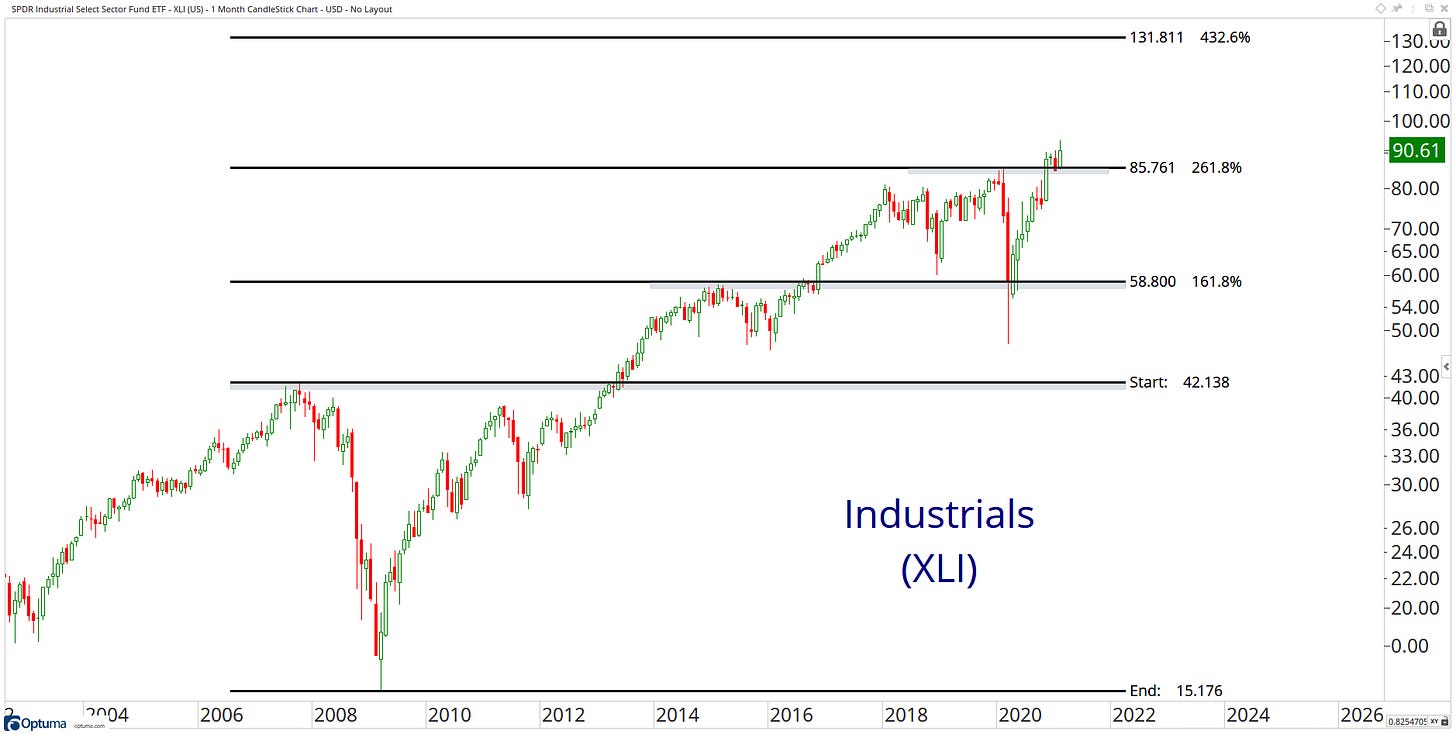
59. SPDR Industrial Select Sector Fund ETF - XLI
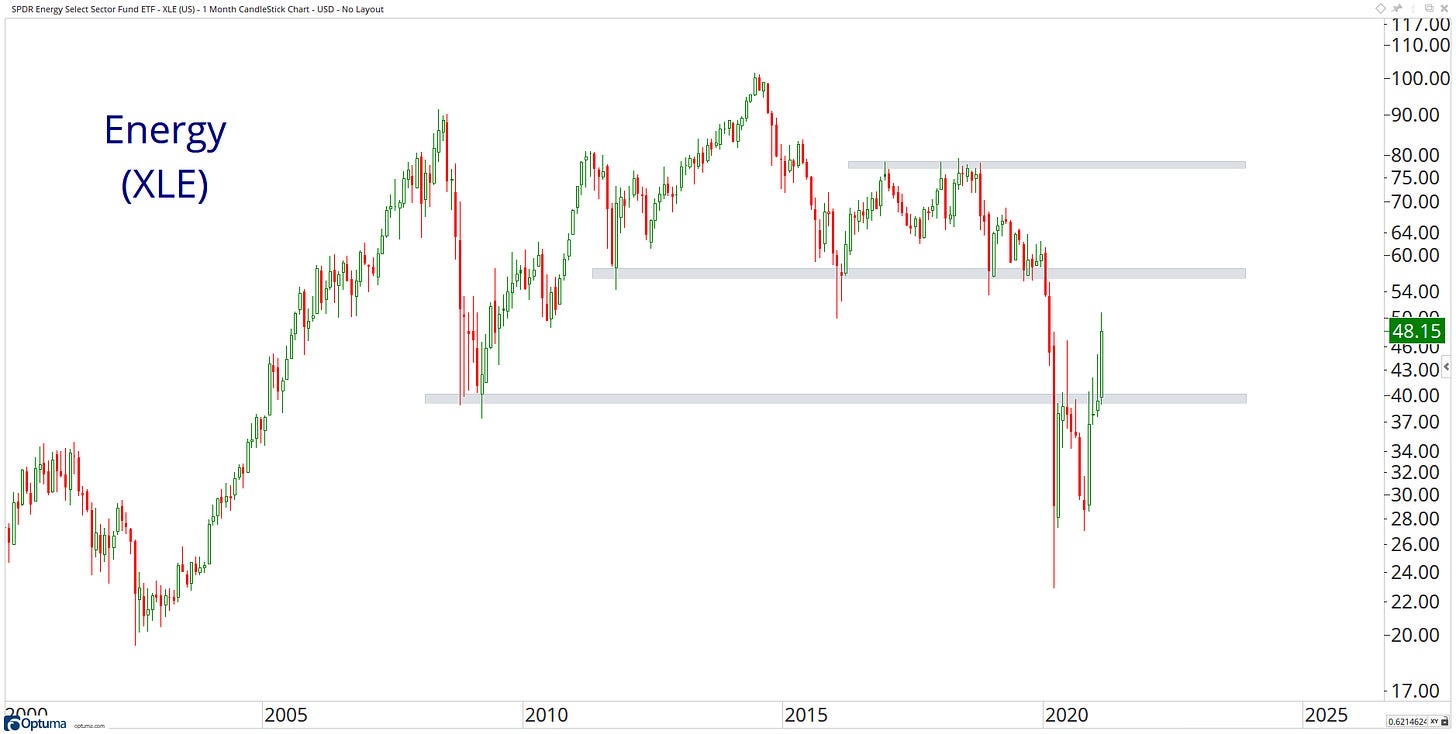
60. SPDR Energy Select Sector Fund ETF - XLE
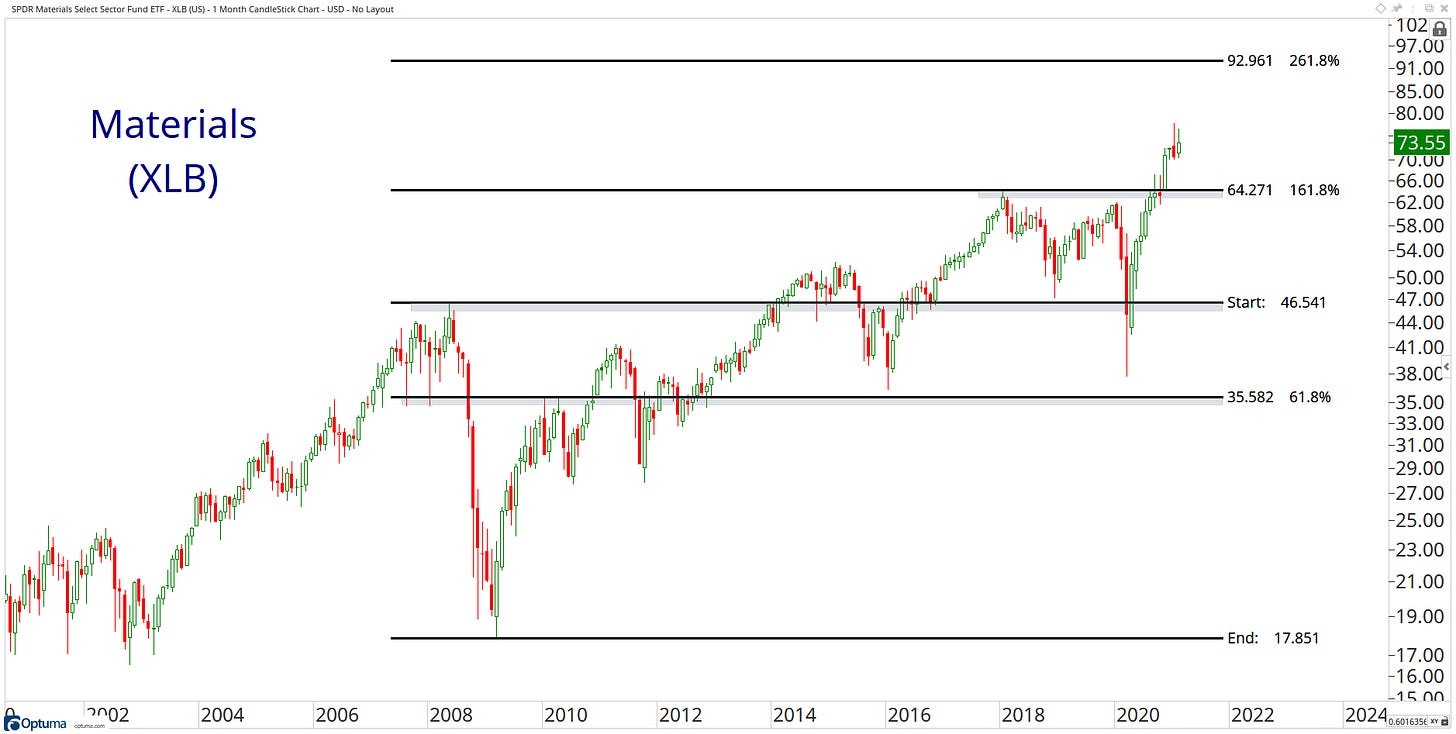
61. SPDR Materials Select Sector Fund ETF - XLB
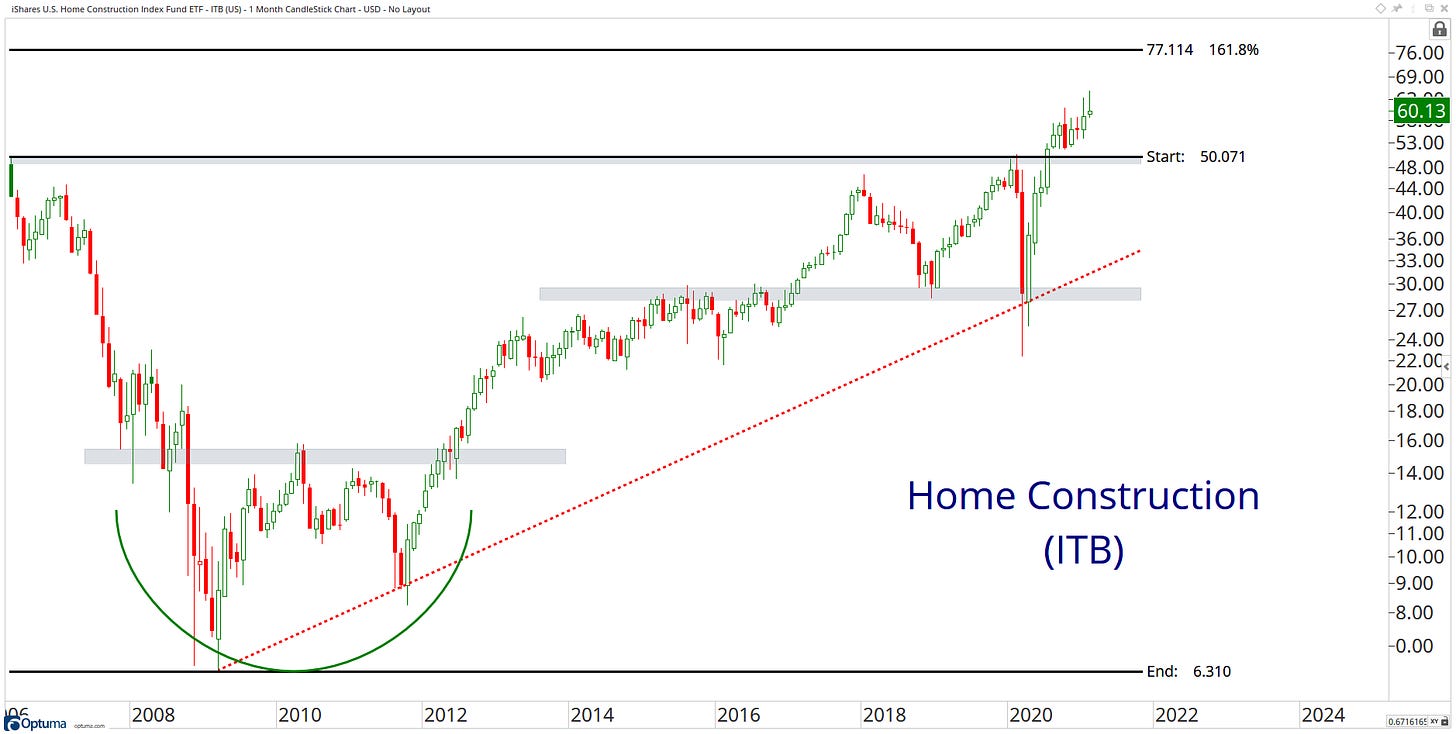
62. iShares U.S. Home Construction Index Fund ETF - ITB
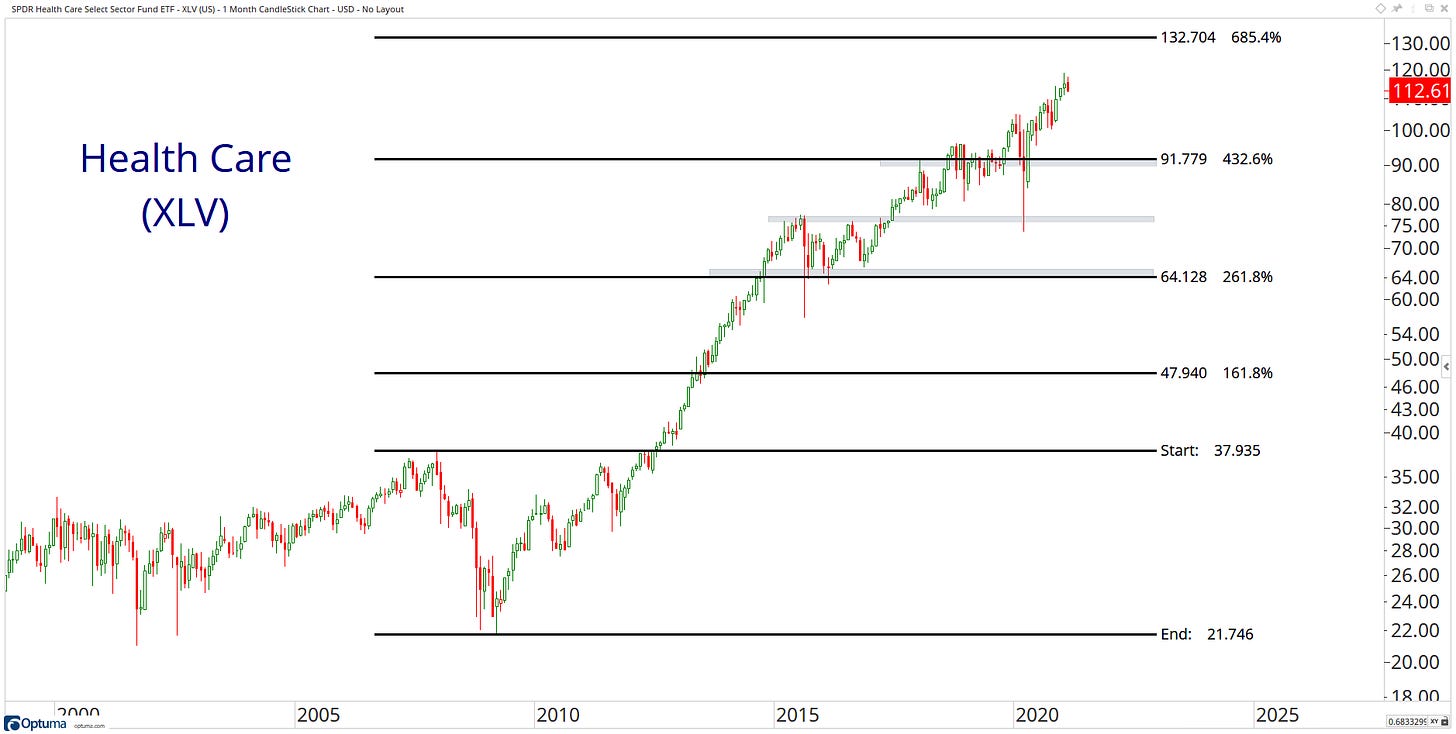
63. SPDR Health Care Select Sector Fund ETF - XLV
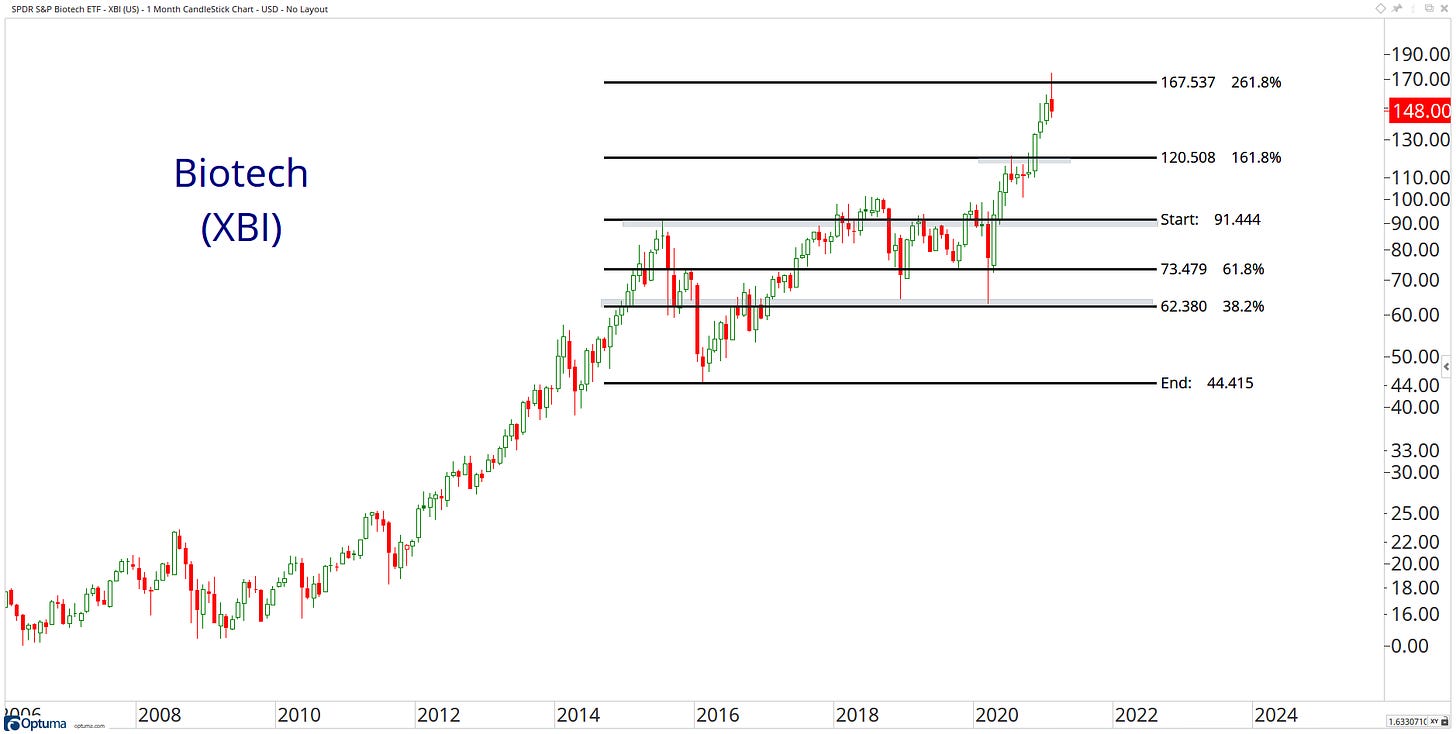
64. SPDR S&P Biotech ETF - XBI
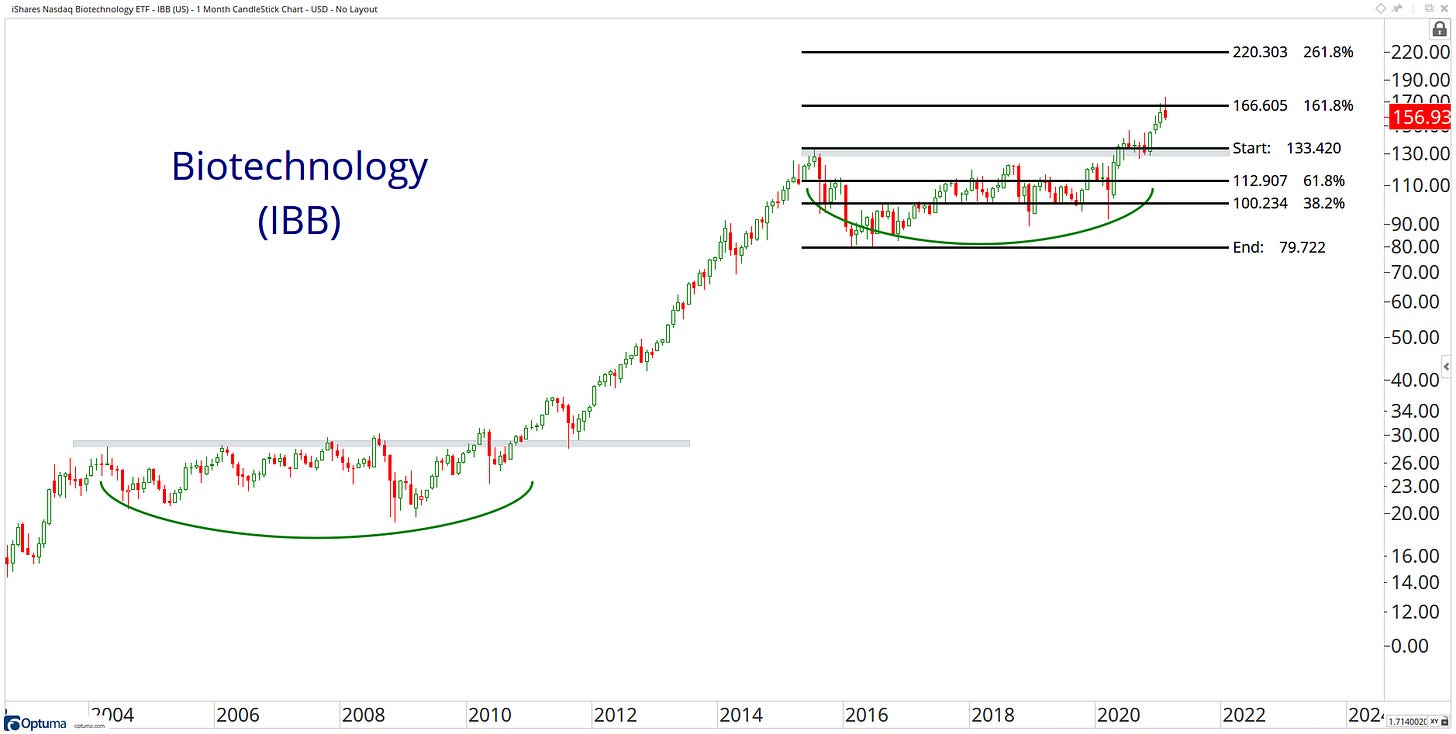
65. iShares Nasdaq Biotechnology ETF - IBB
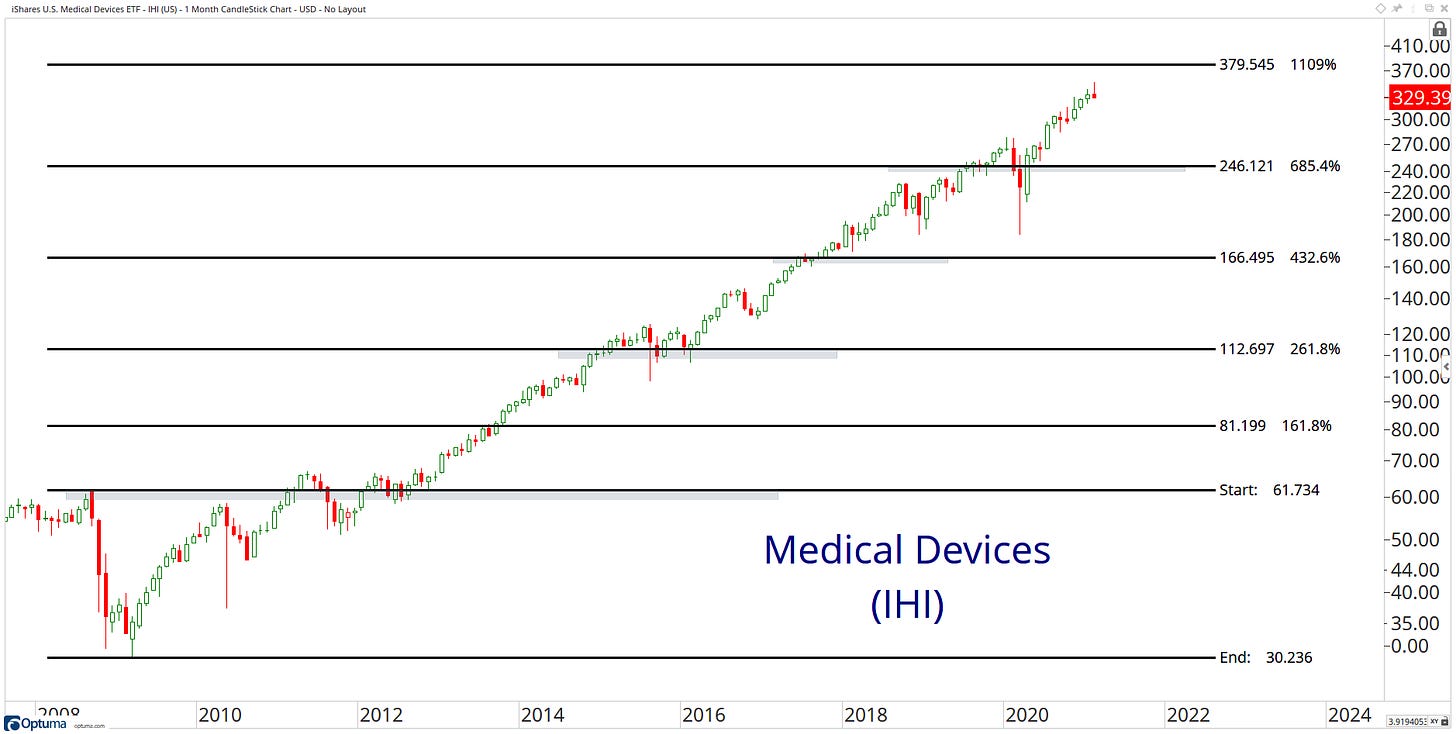
66. iShares U.S. Medical Devices ETF - IHI
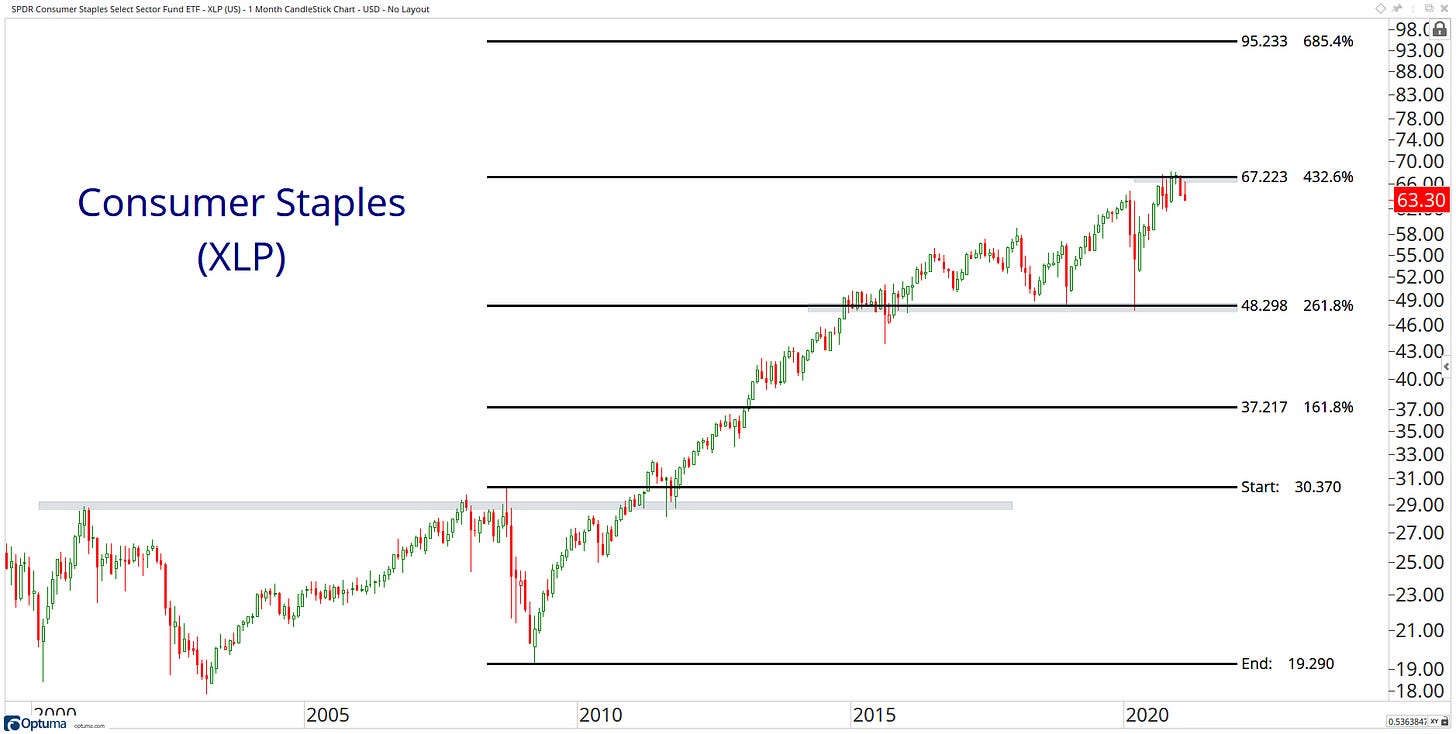
67. SPDR Consumer Staples Select Sector Fund ETF - XLP
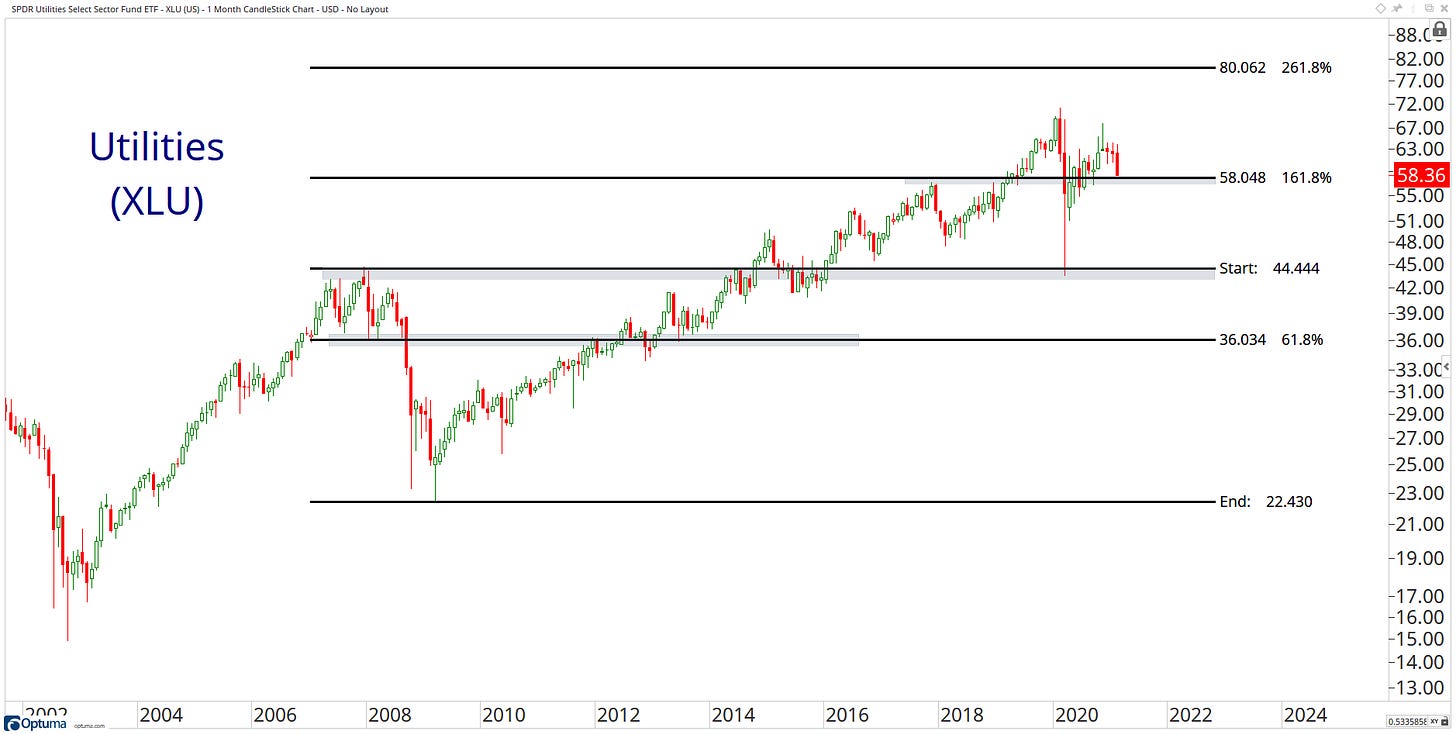
68. SPDR Utilities Select Sector Fund ETF - XLU
69. Dow Jones Utility Average - DJU
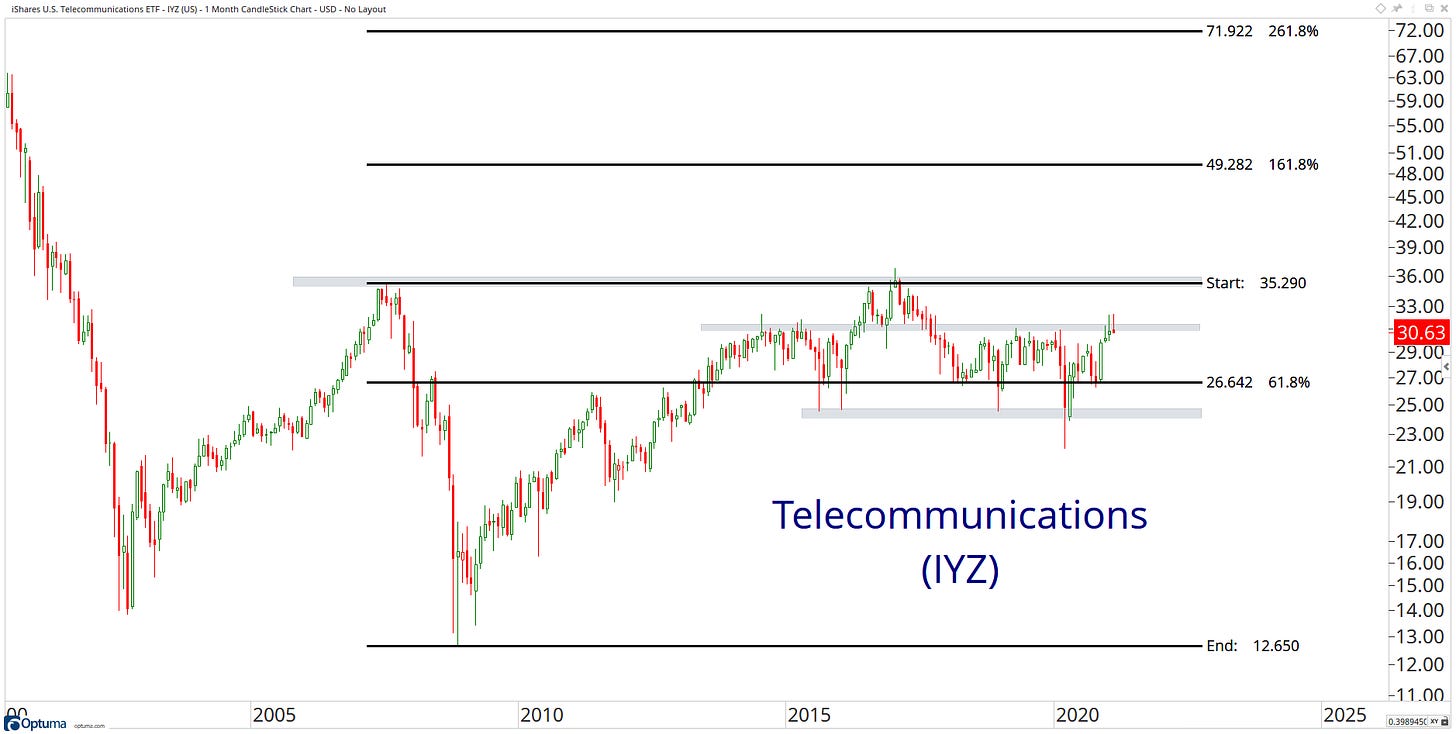
70. iShares U.S. Telecommunications ETF - IYZ
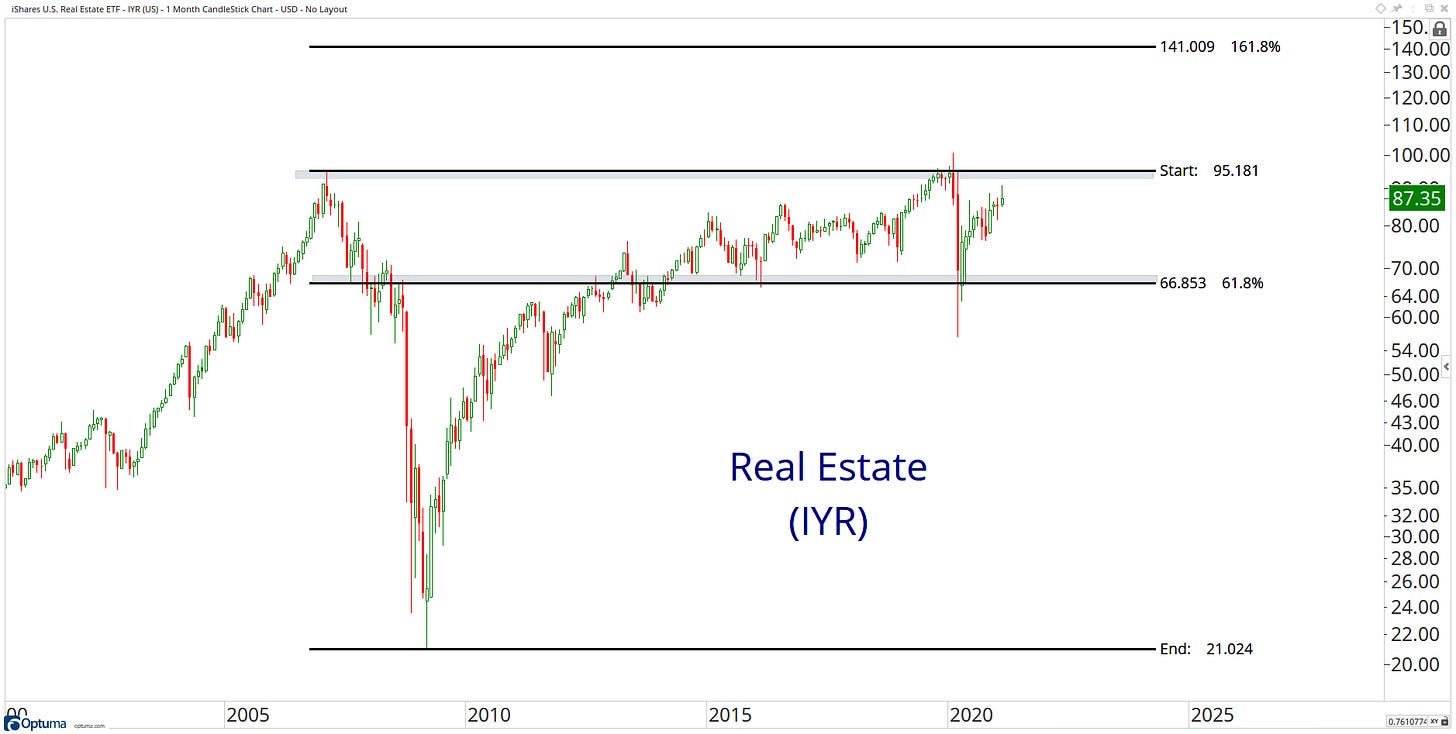
71. iShares U.S. Real Estate ETF - IYR
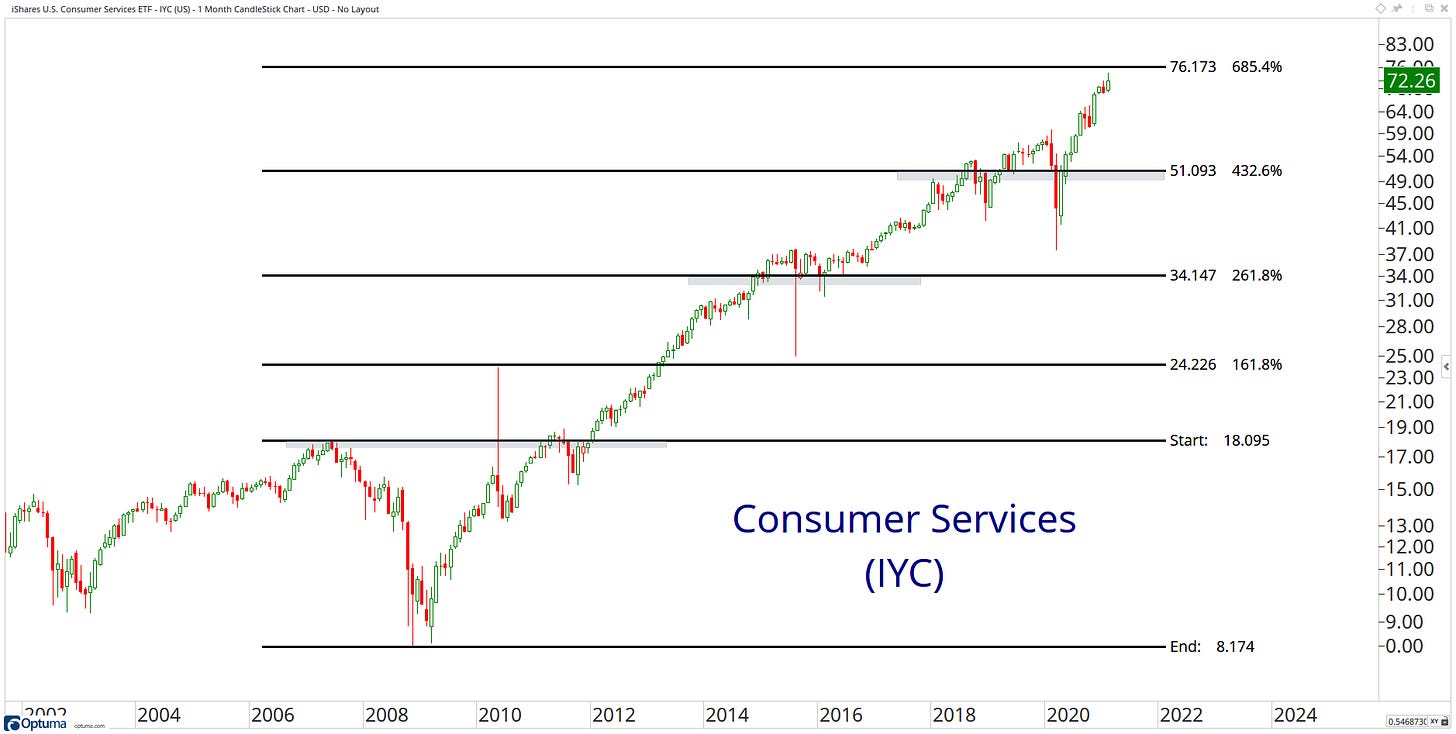
72. iShares U.S. Consumer Services ETF - IYC
73. iShares U.S. Consumer Goods ETF - IYK
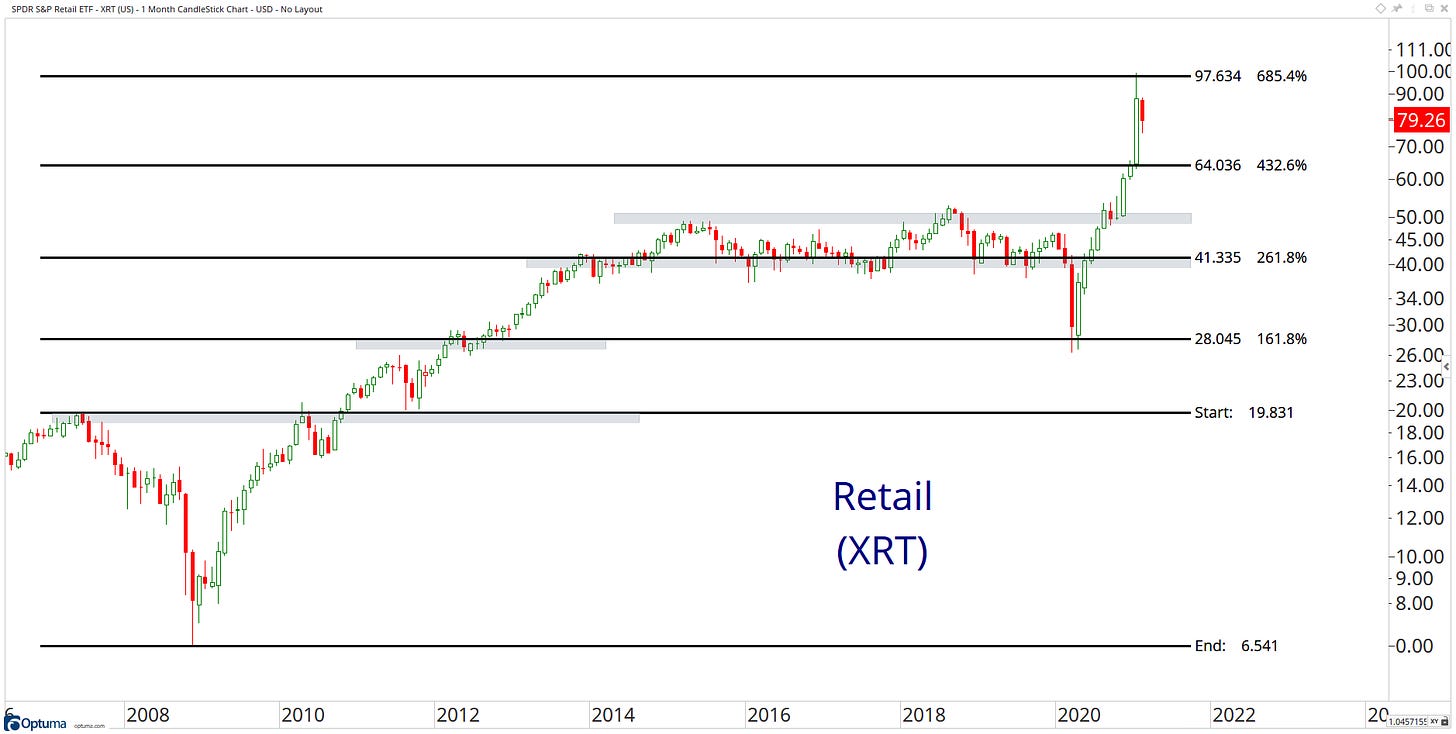
74. SPDR S&P Retail ETF - XRT
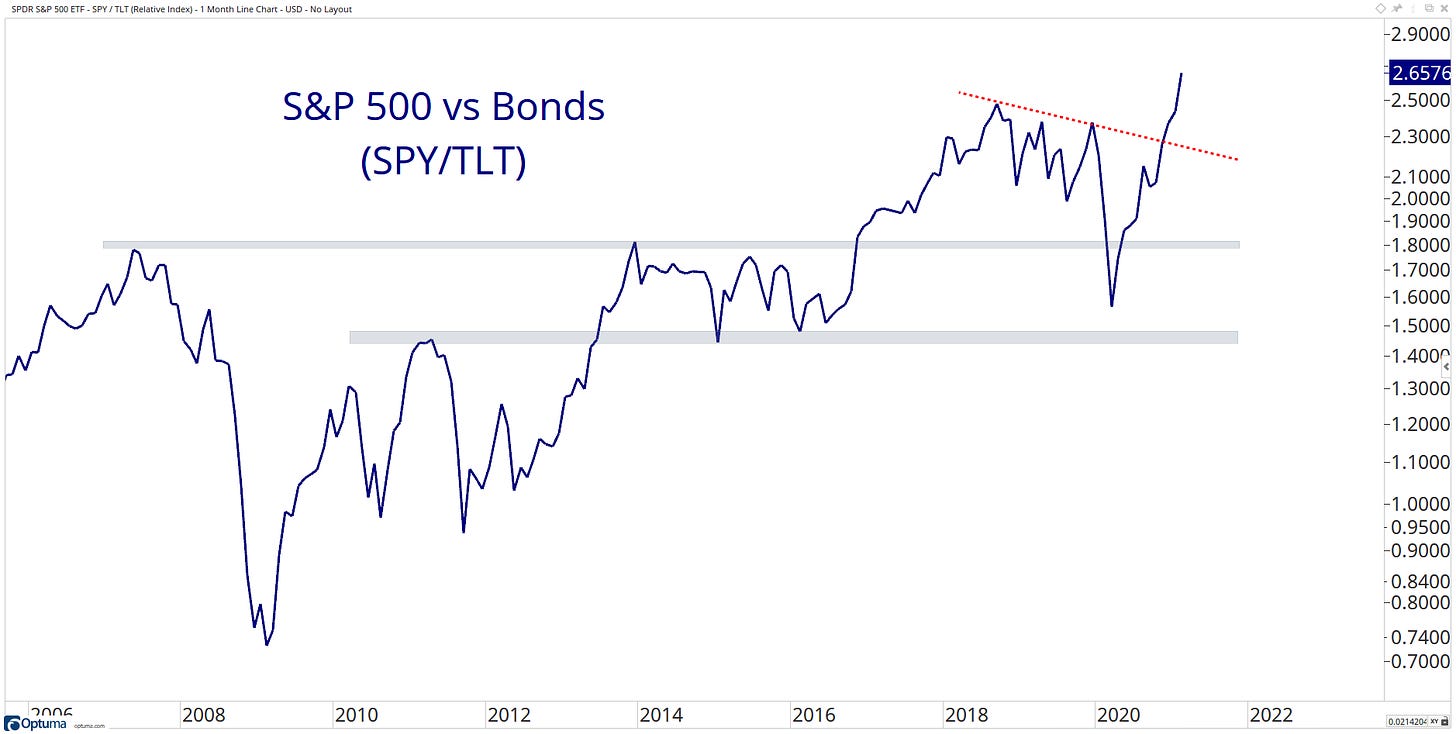
75. SPY / TLT
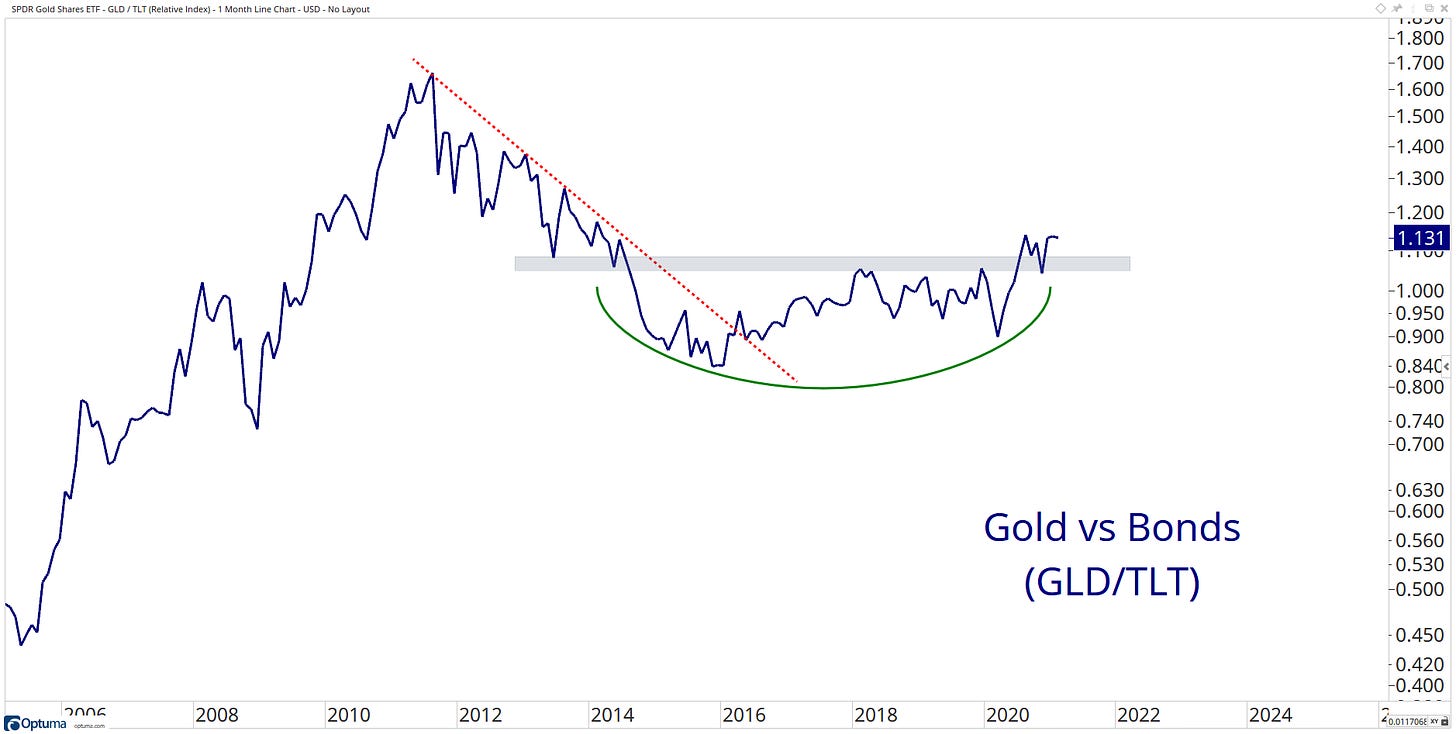
76. GLD / TLT
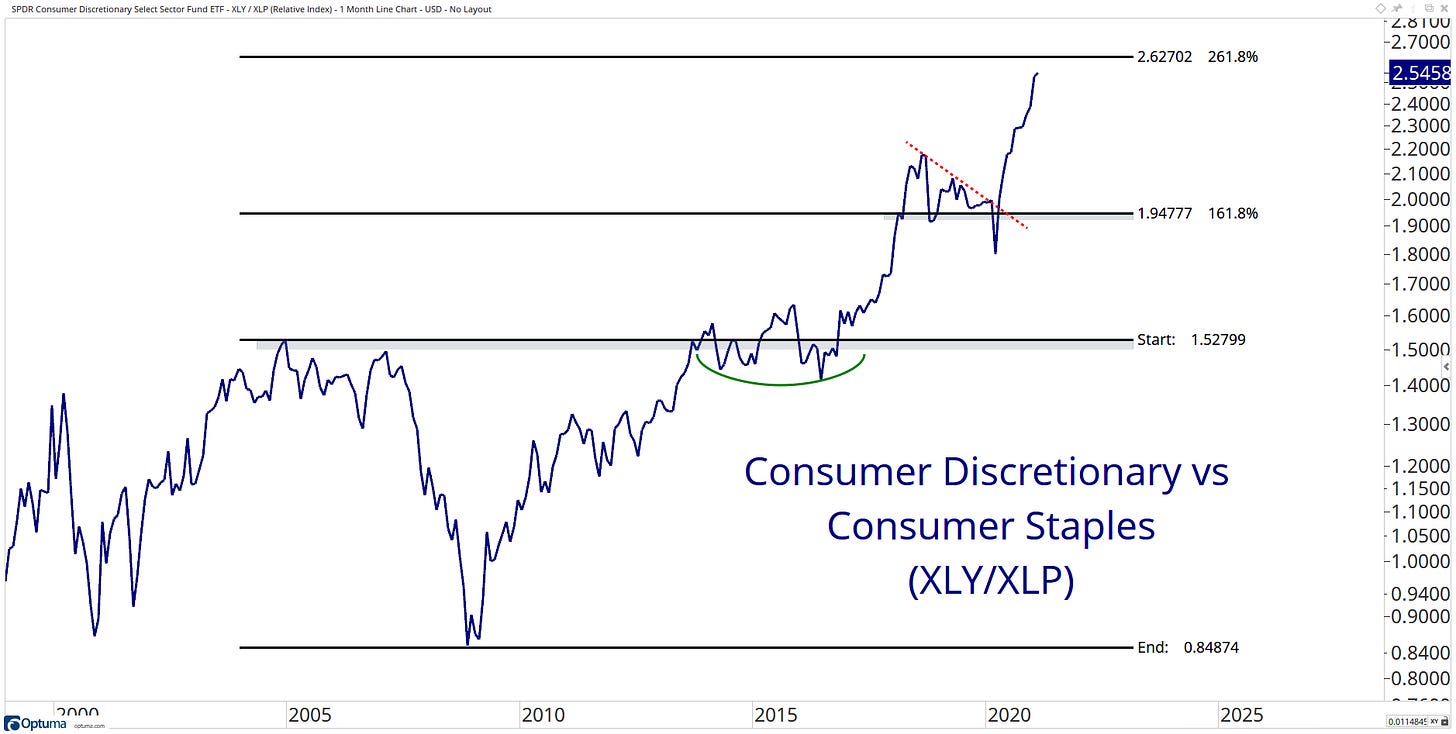
77. XLY / XLP
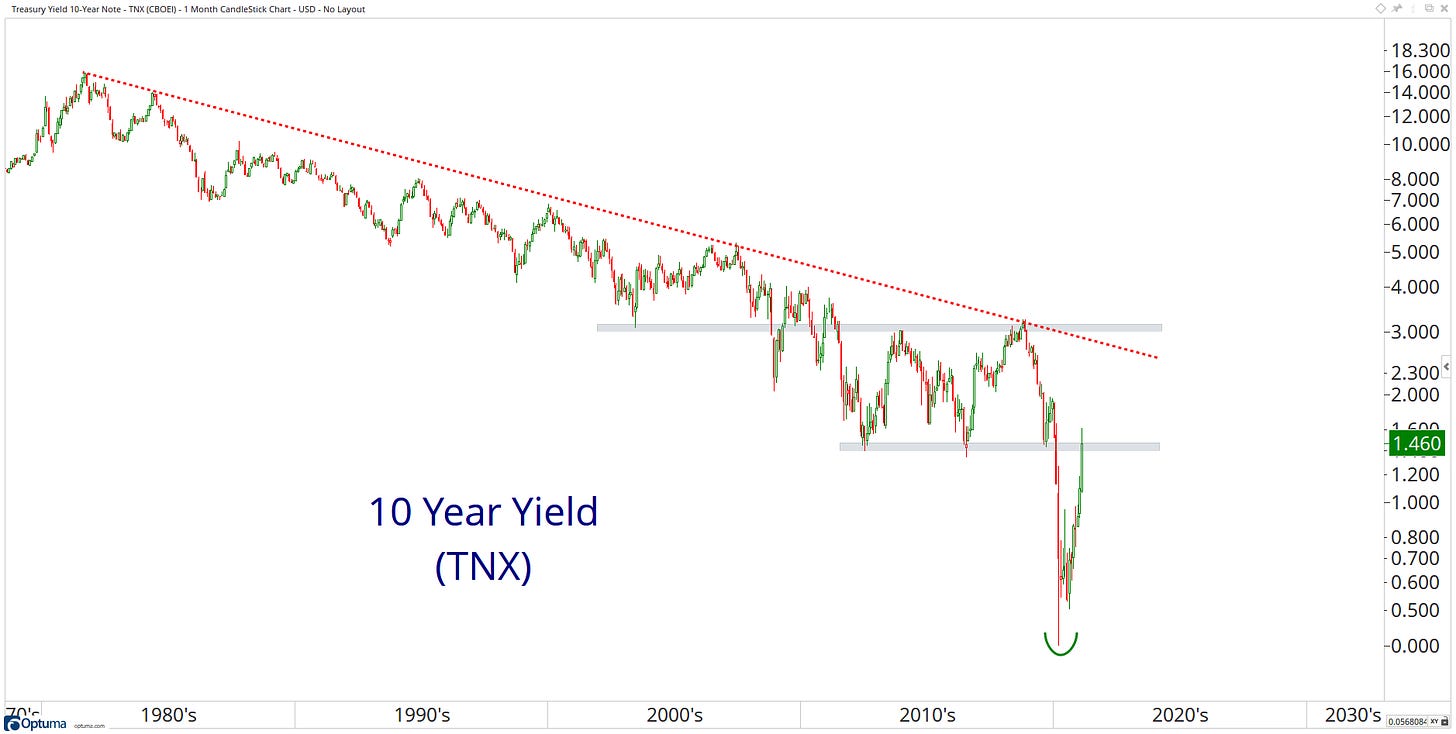
78. Treasury Yield 10-Year Note - TNX
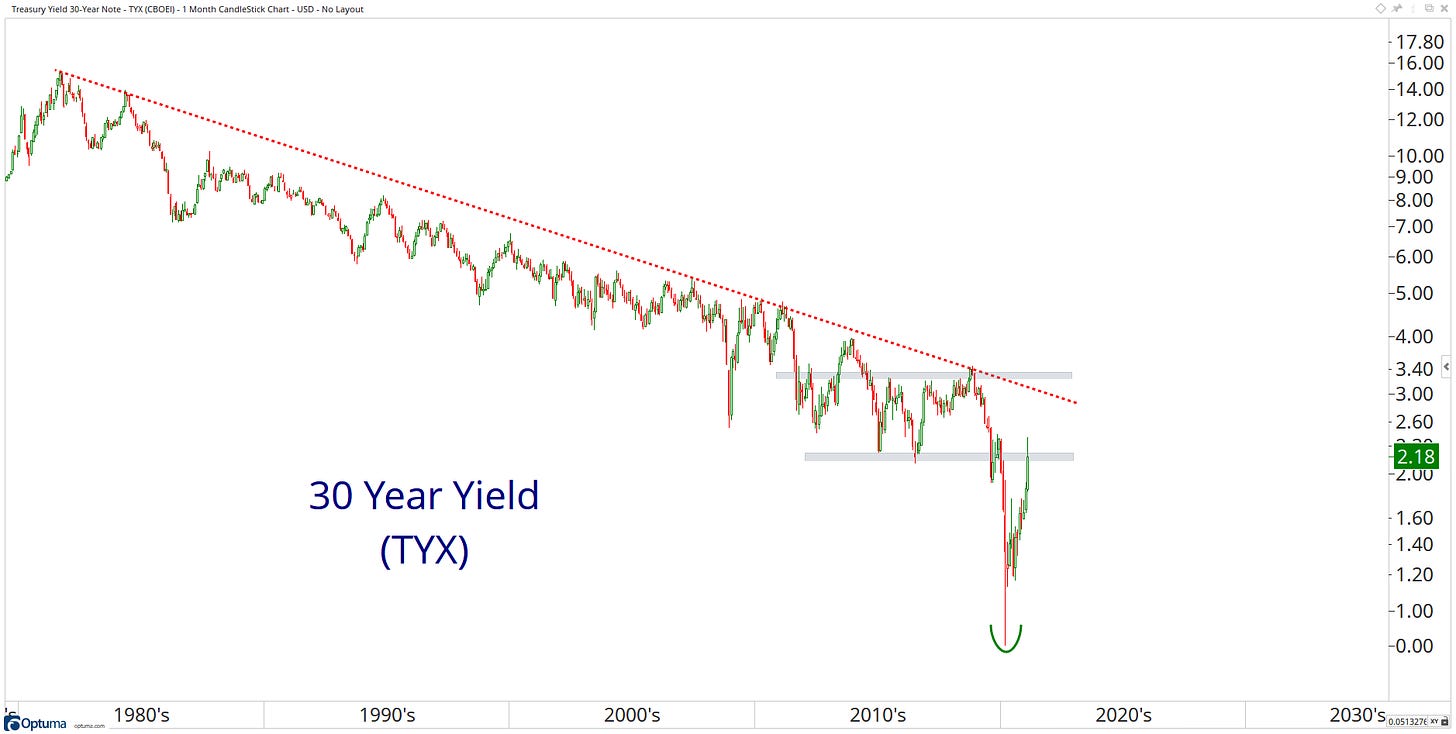
79. Treasury Yield 30-Year Note - TYX
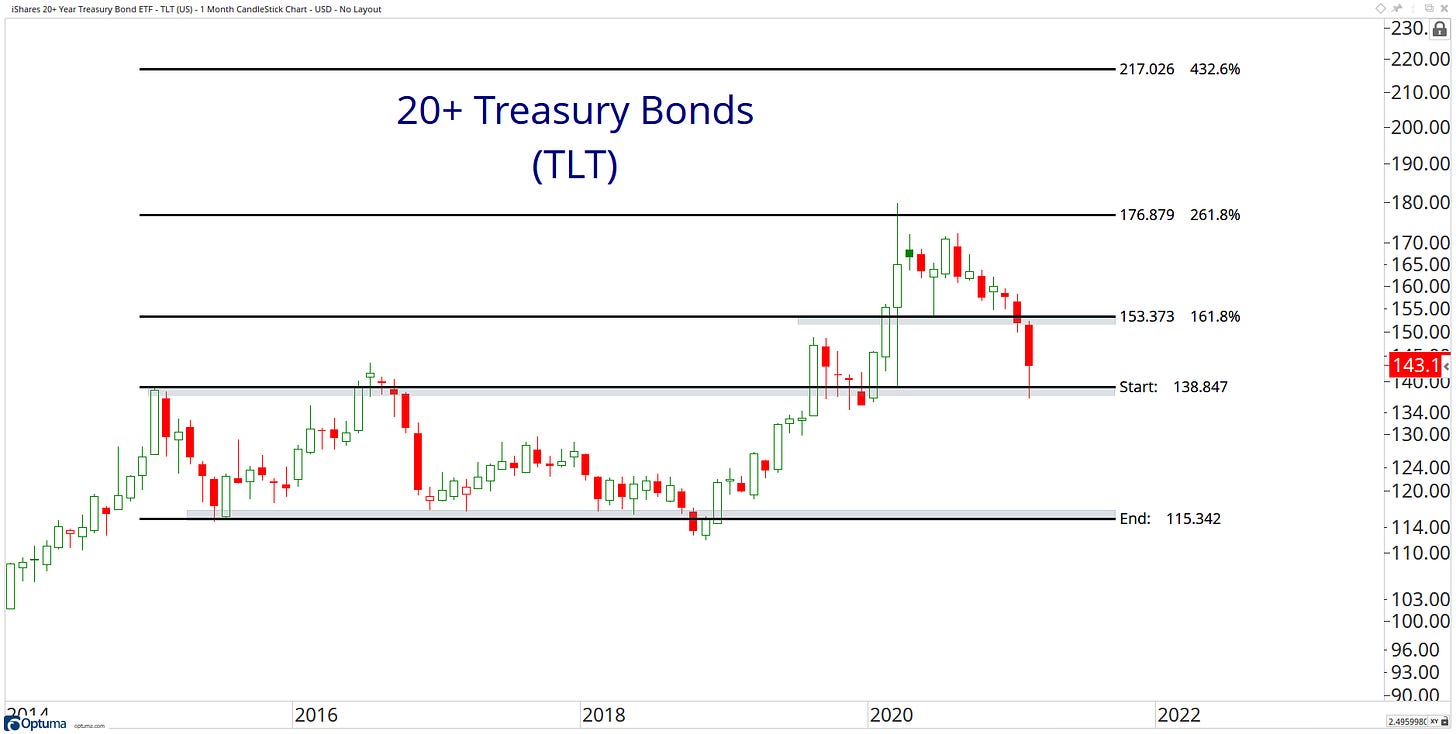
80. iShares 20+ Year Treasury Bond ETF - TLT
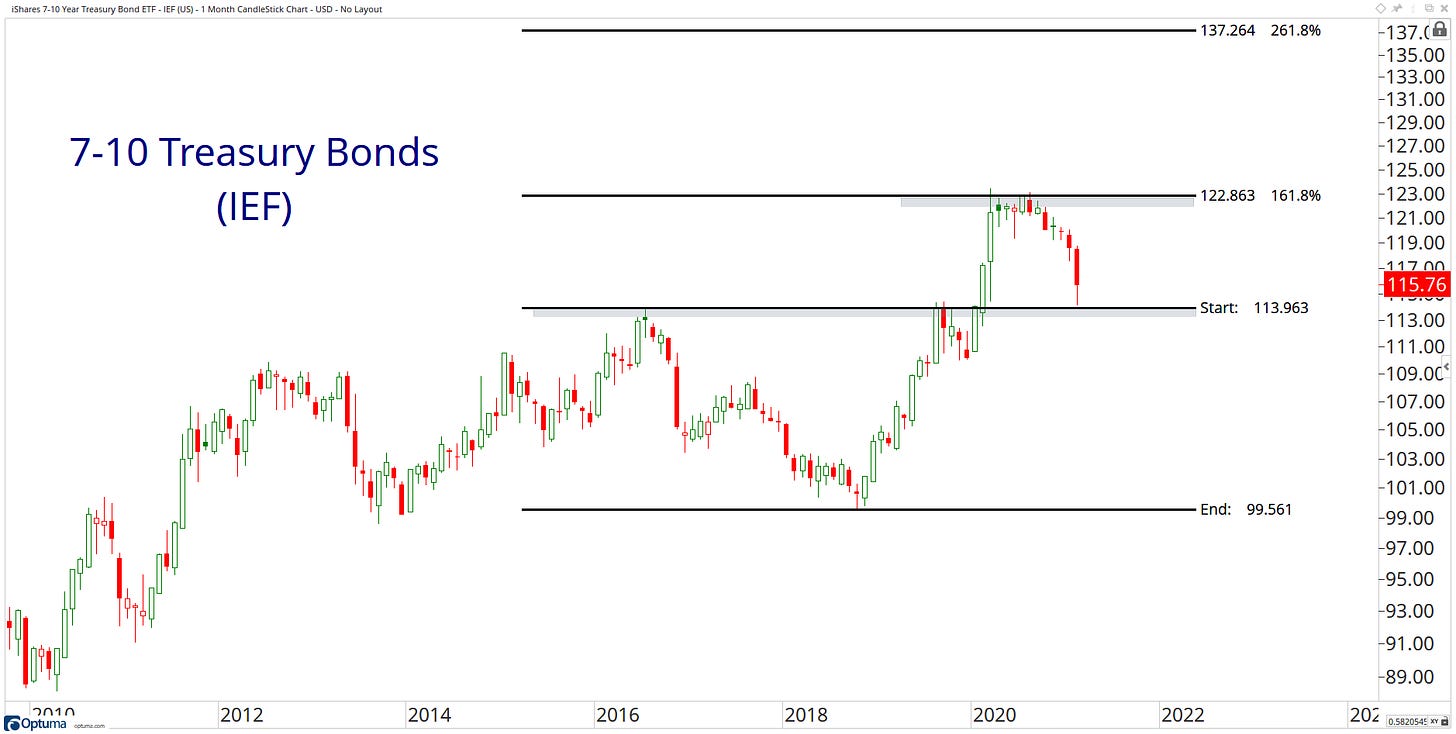
81. iShares 7-10 Year Treasury Bond ETF - IEF
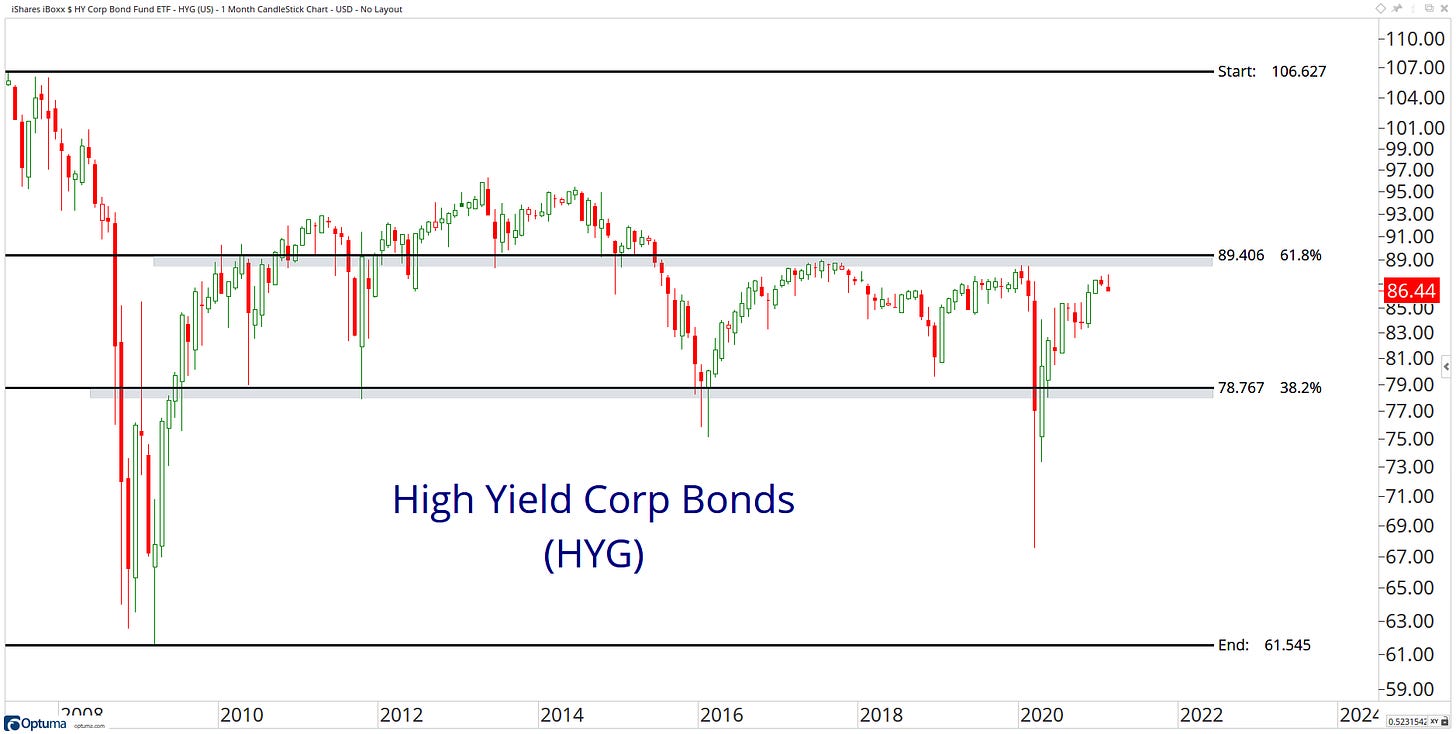
82. iShares iBoxx $ HY Corp Bond Fund ETF - HYG
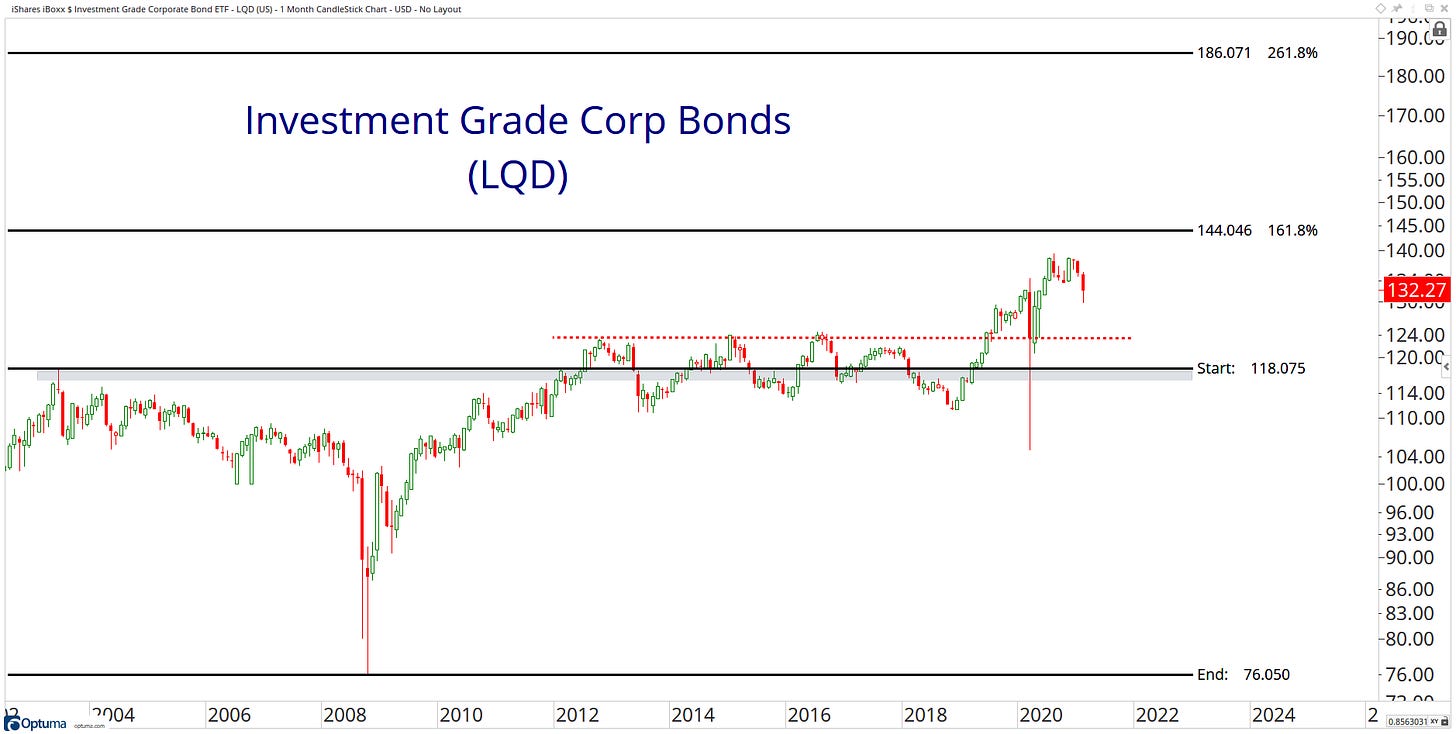
83. iShares iBoxx $ Investment Grade Corporate Bond ETF - LQD
84. iShares TIPS Bond ETF - TIP
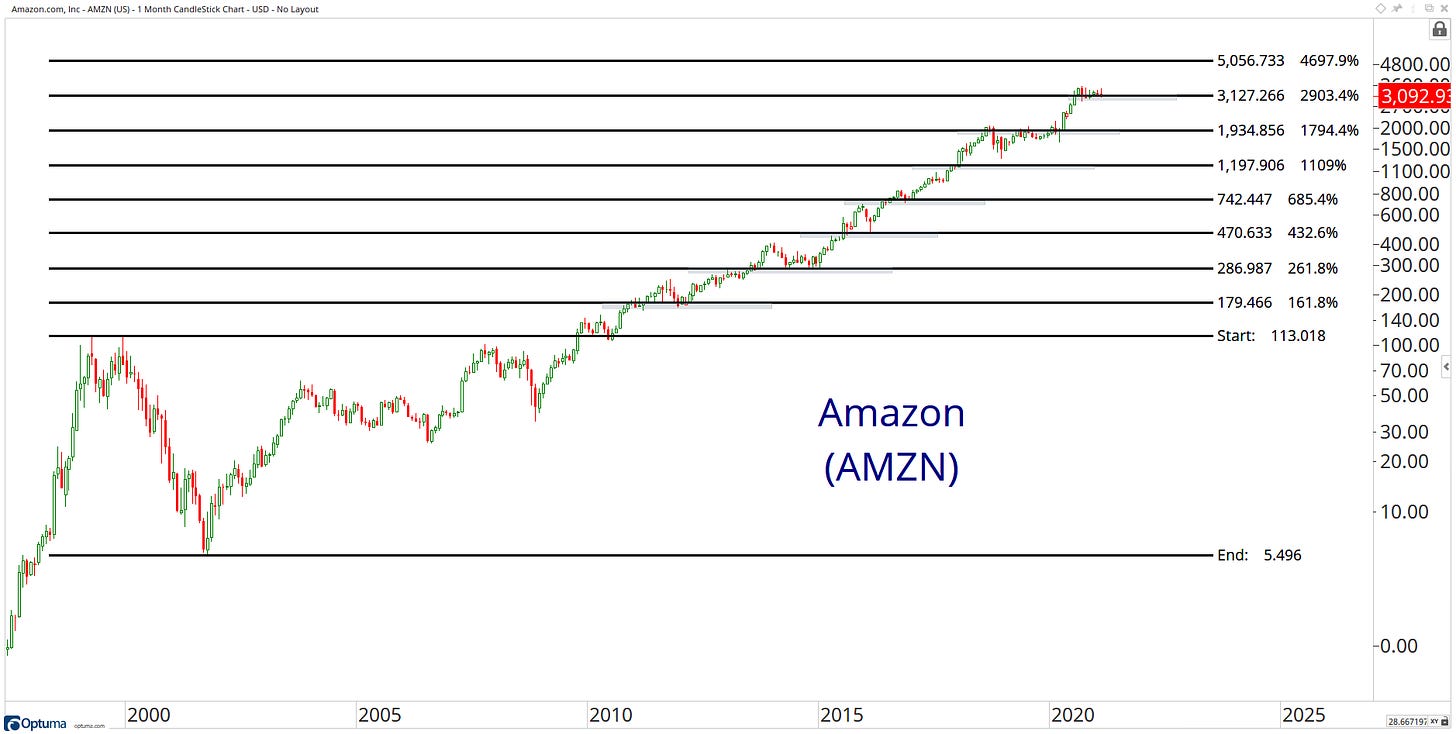
85. Amazon.com, Inc - AMZN
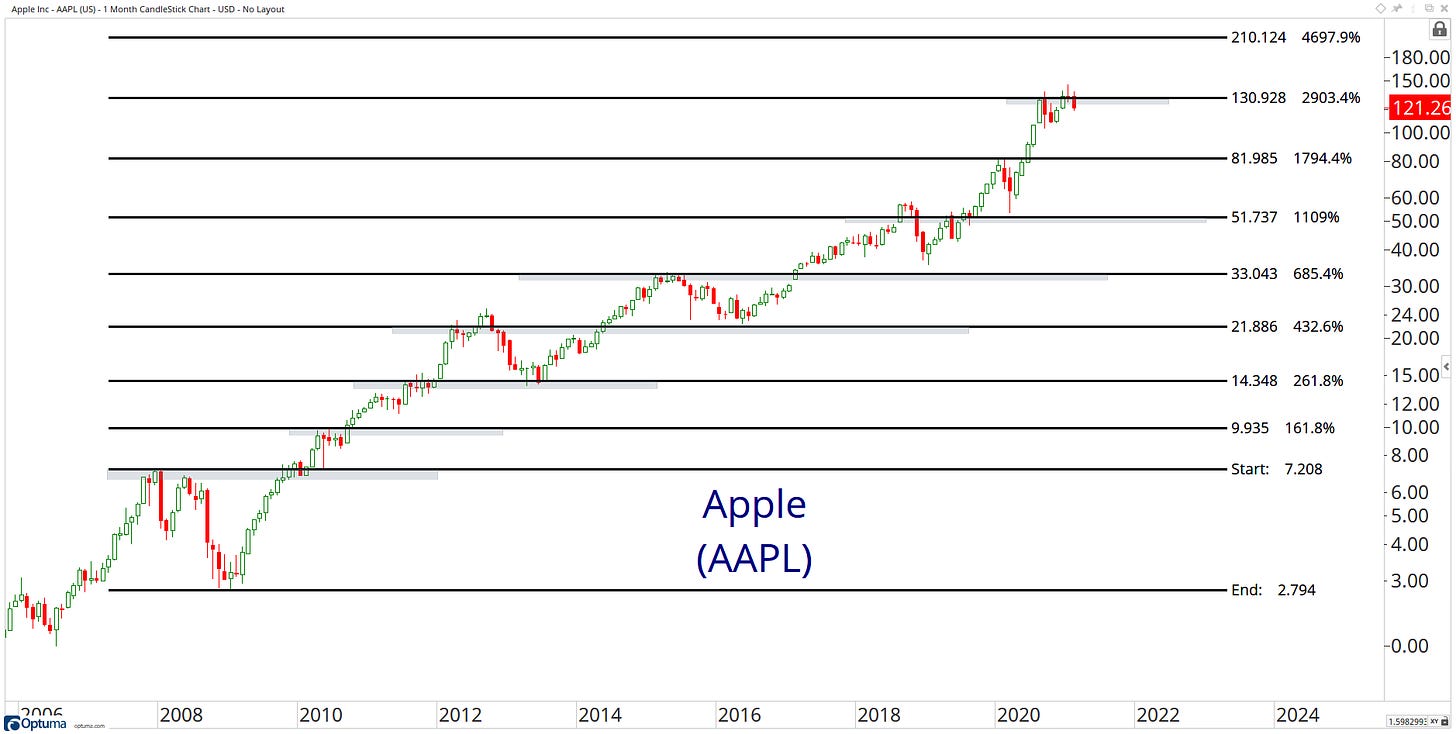
86. Apple Inc - AAPL
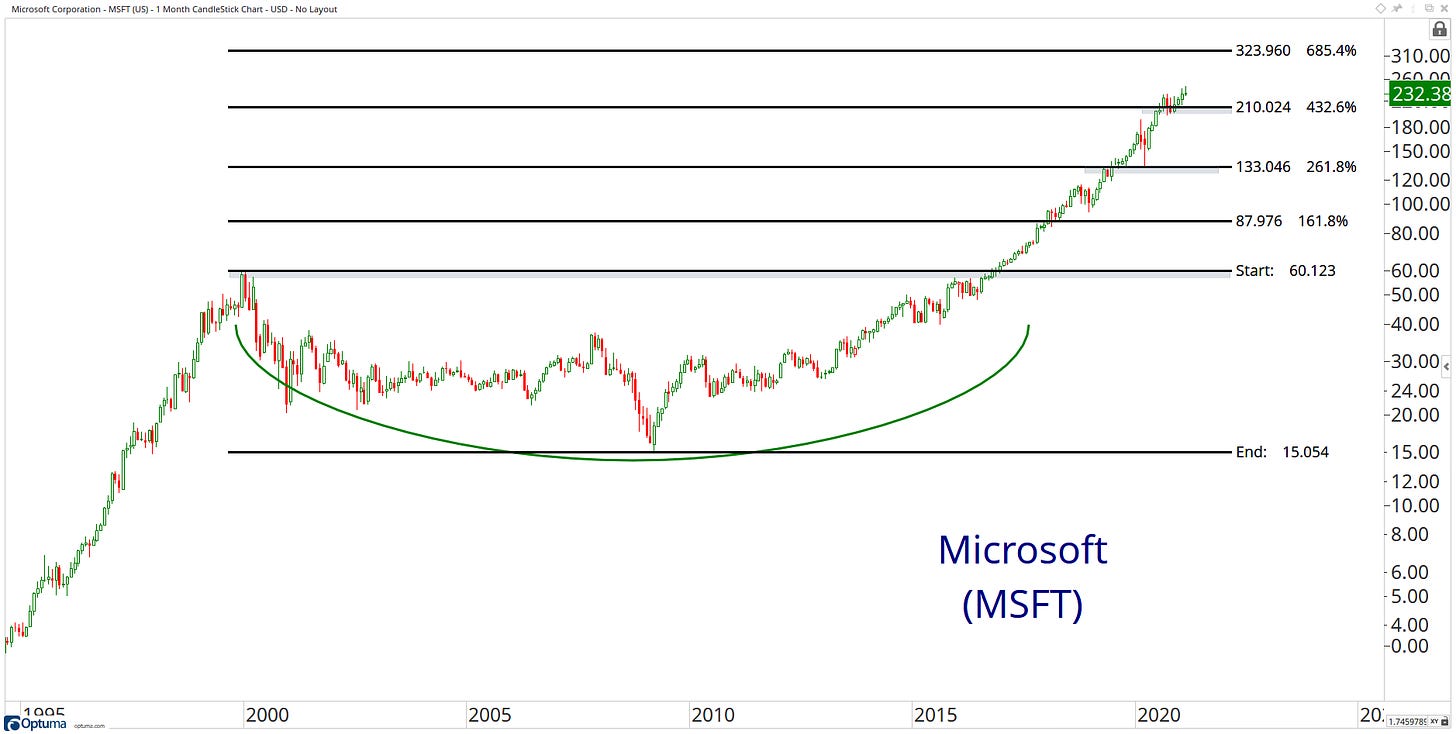
87. Microsoft Corporation - MSFT
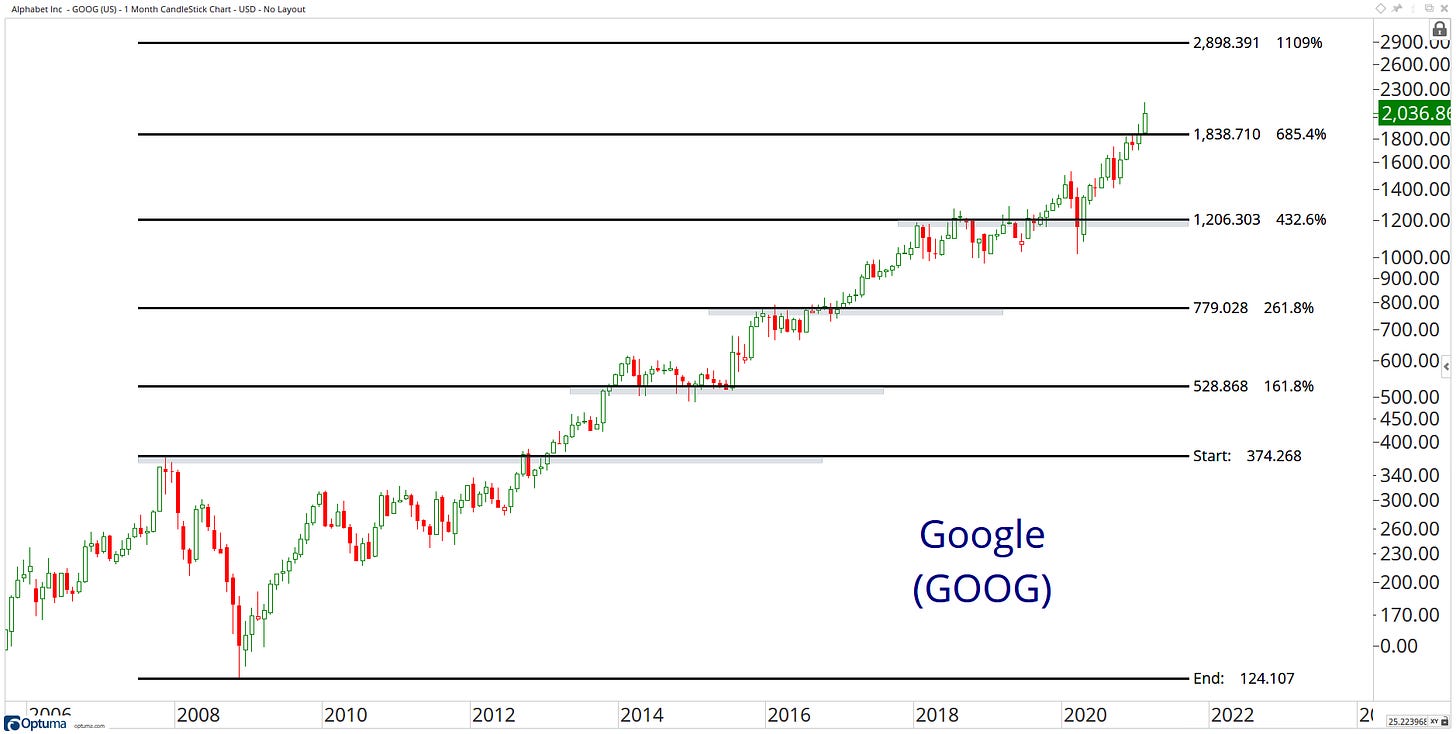
88. Alphabet Inc - GOOG
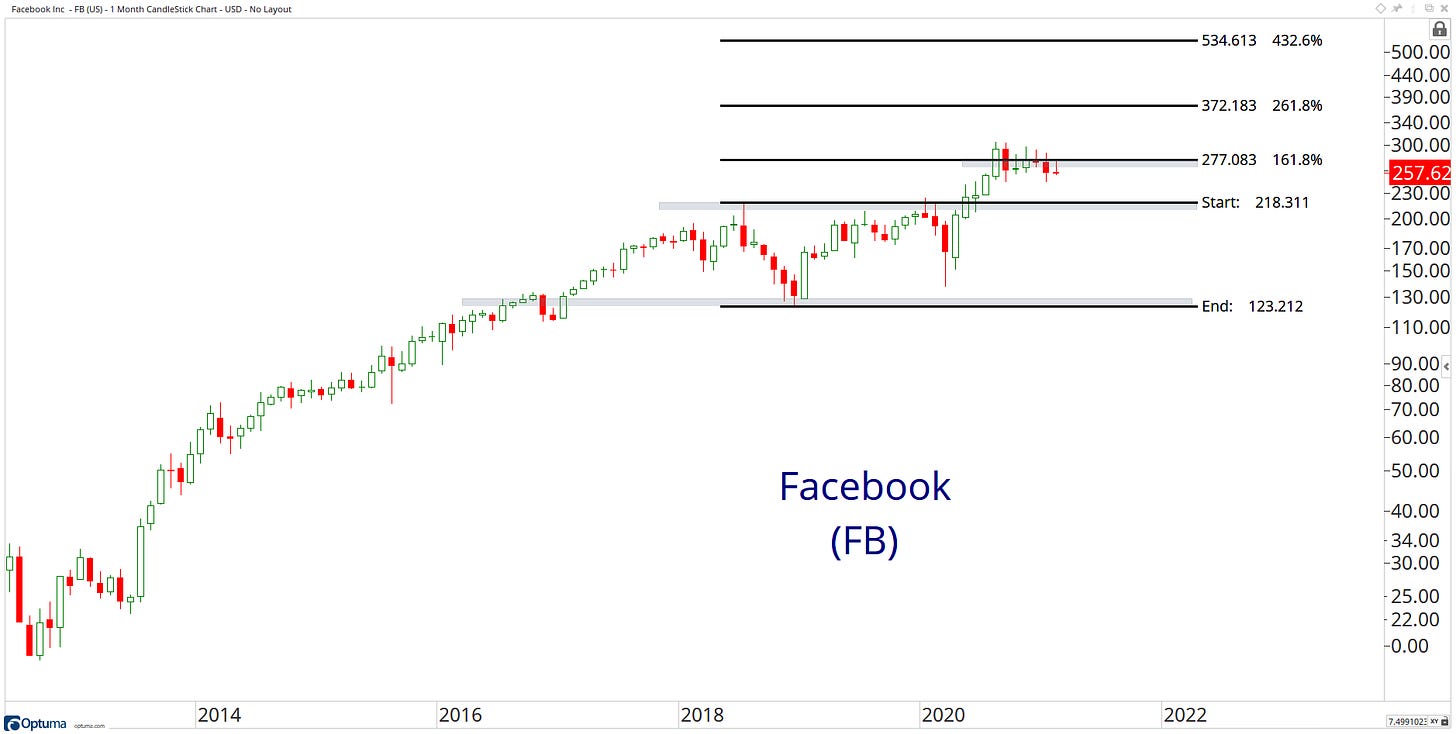
89. Facebook Inc - FB
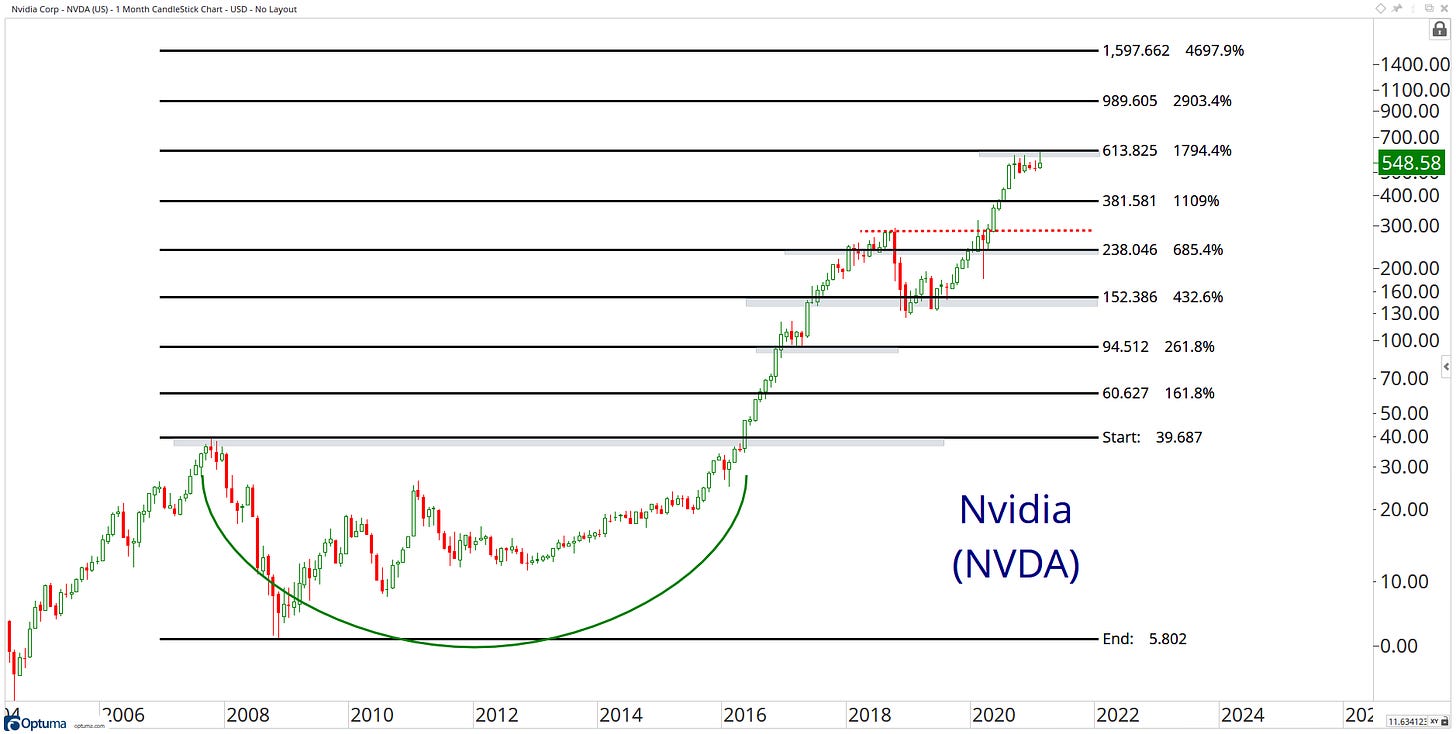
90. Nvidia Corp - NVDA
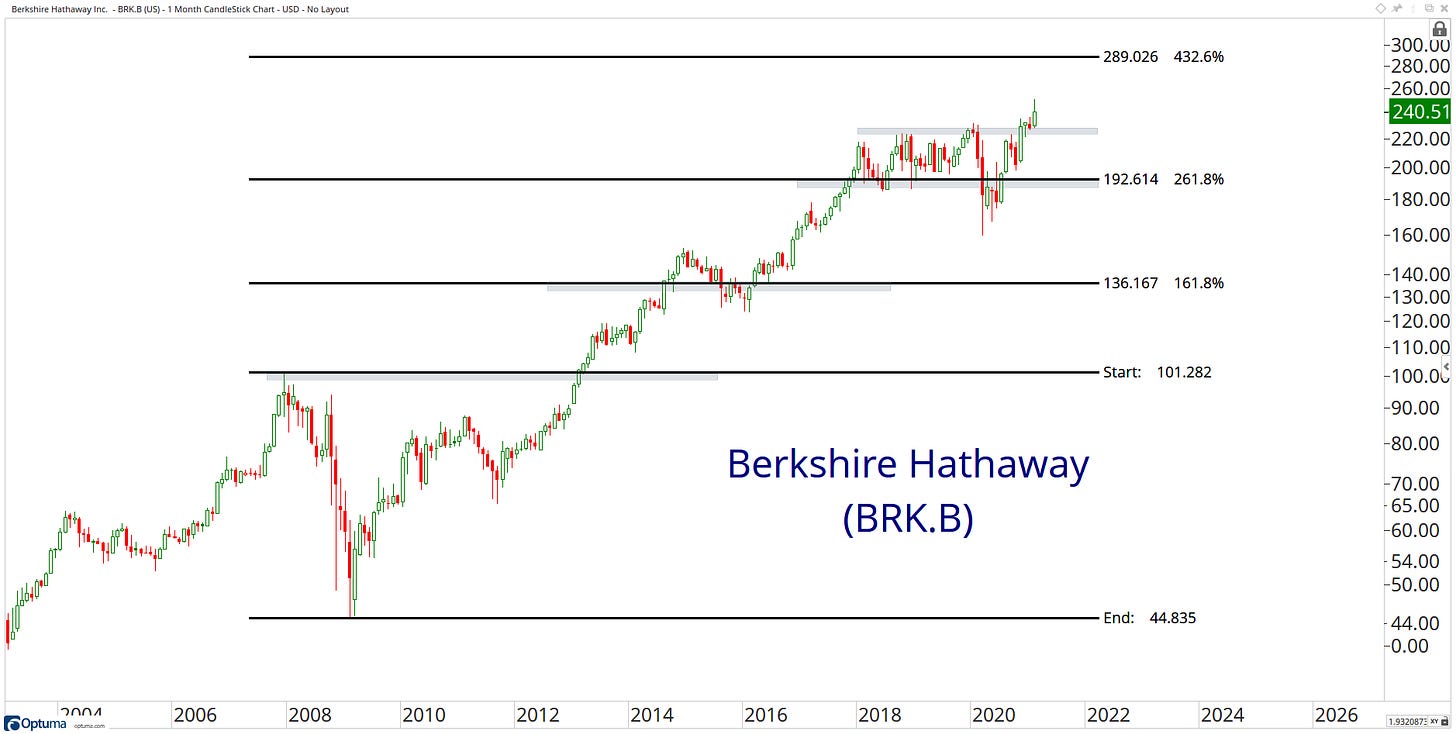
91. Berkshire Hathaway Inc. - BRK.B
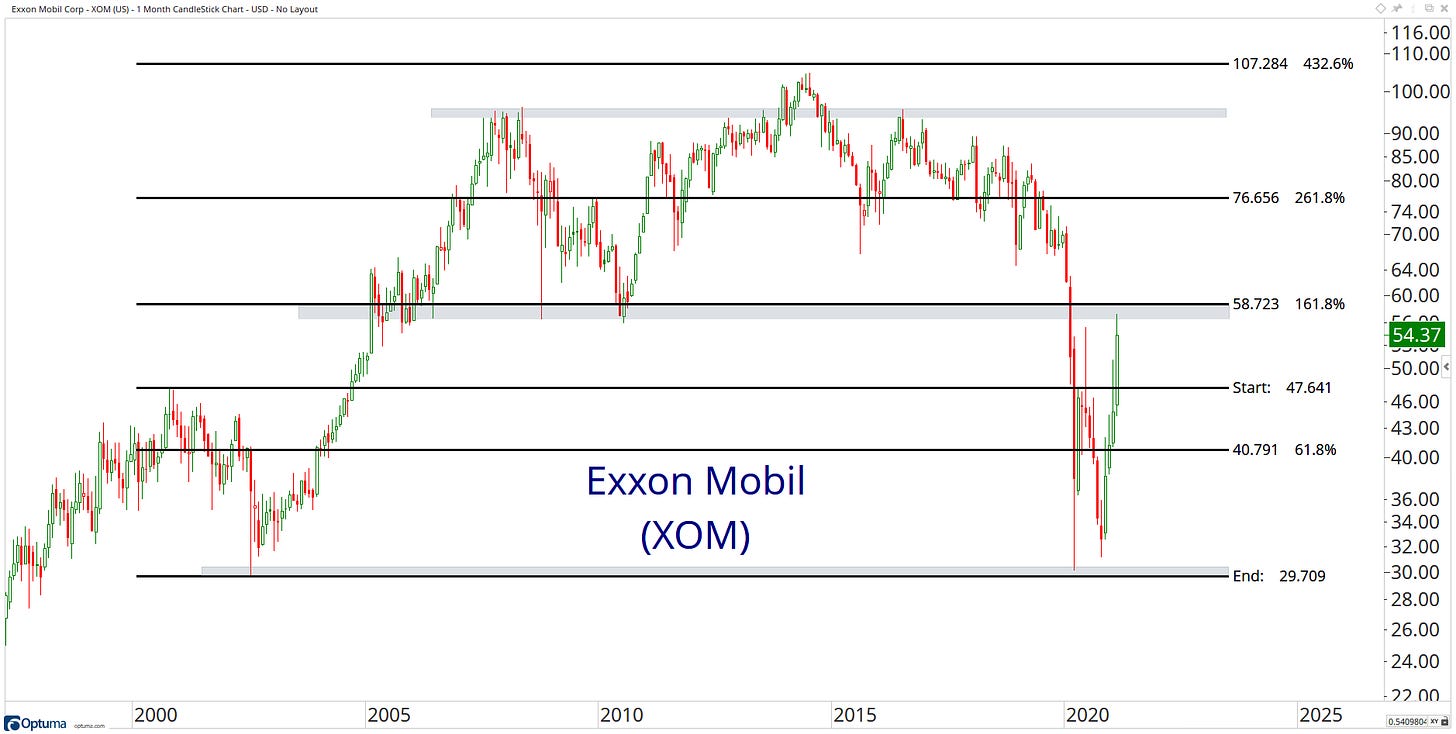
92. Exxon Mobil Corp - XOM
93. General Electric Co - GE
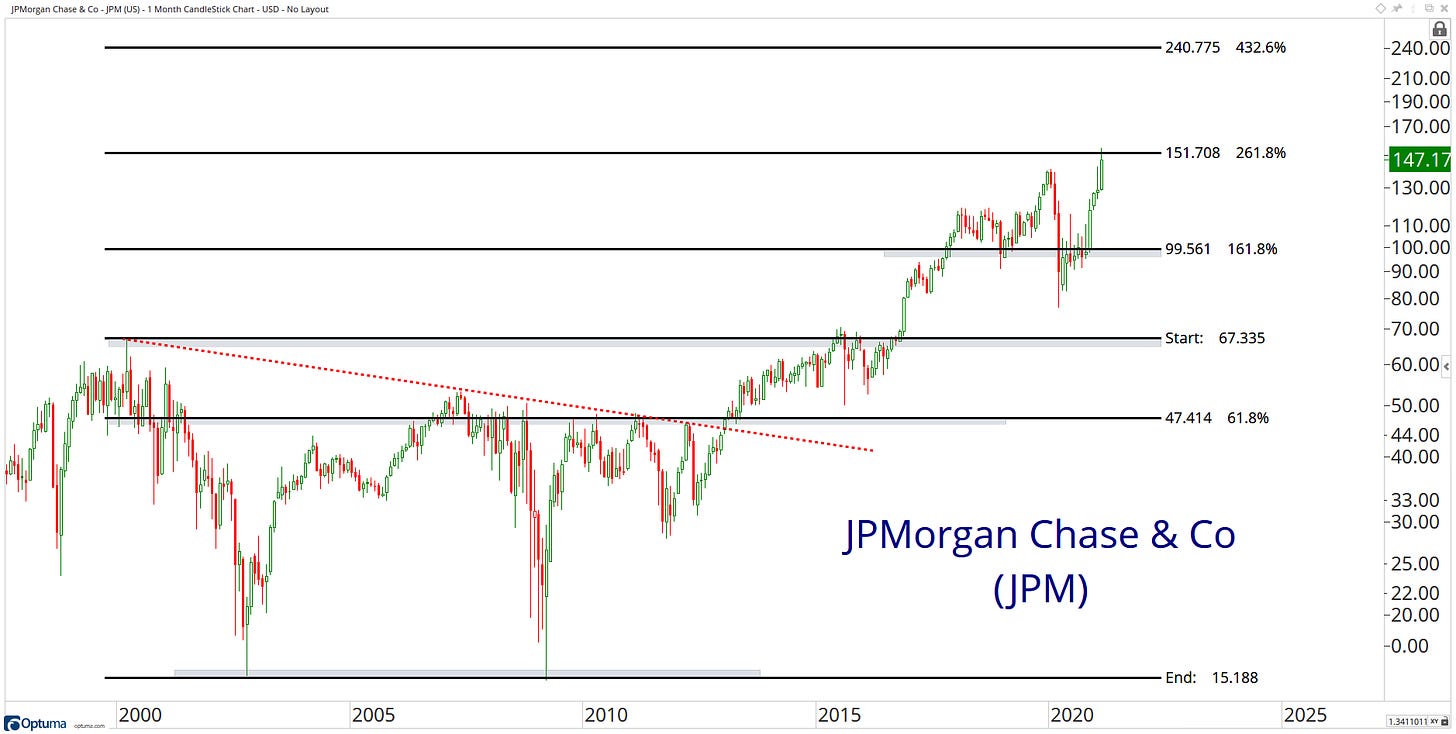
94. JPMorgan Chase & Co - JPM
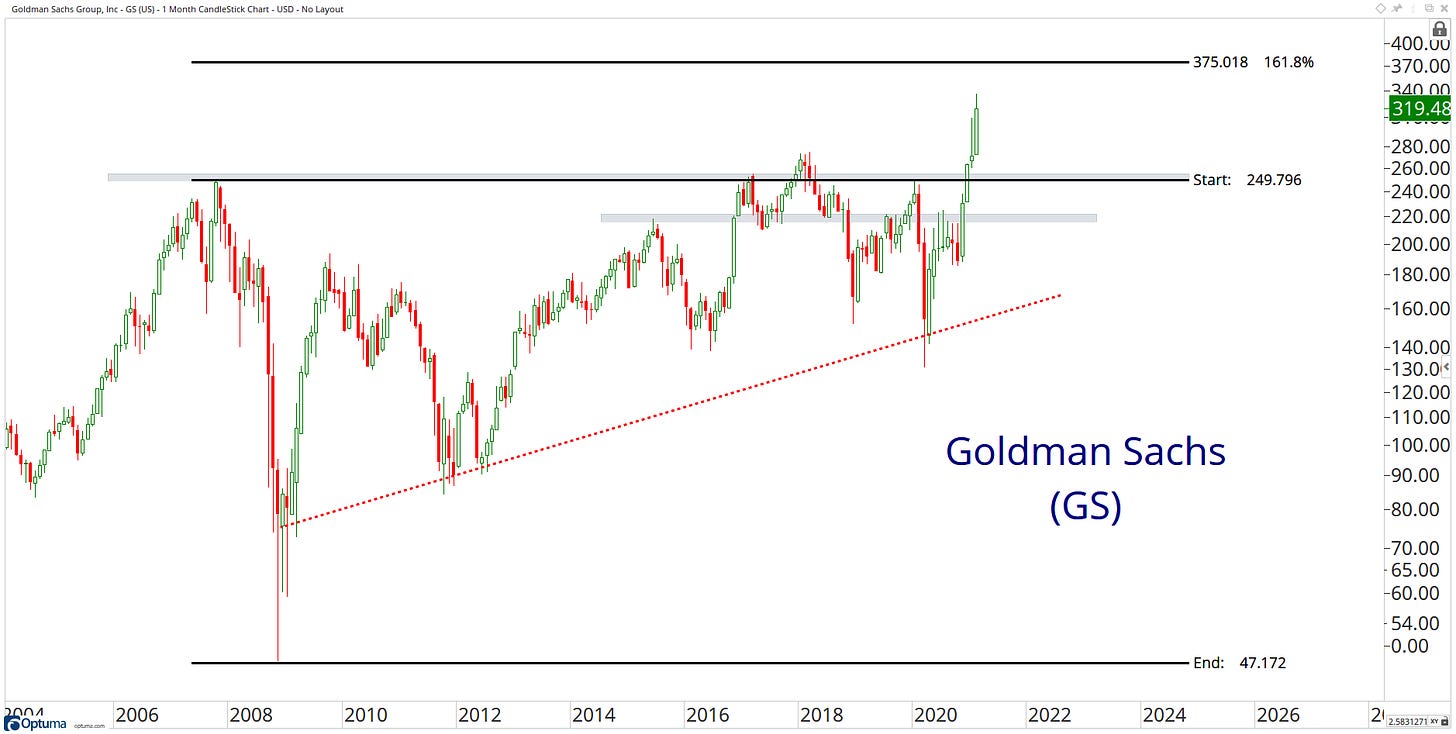
95. Goldman Sachs Group, Inc - GS
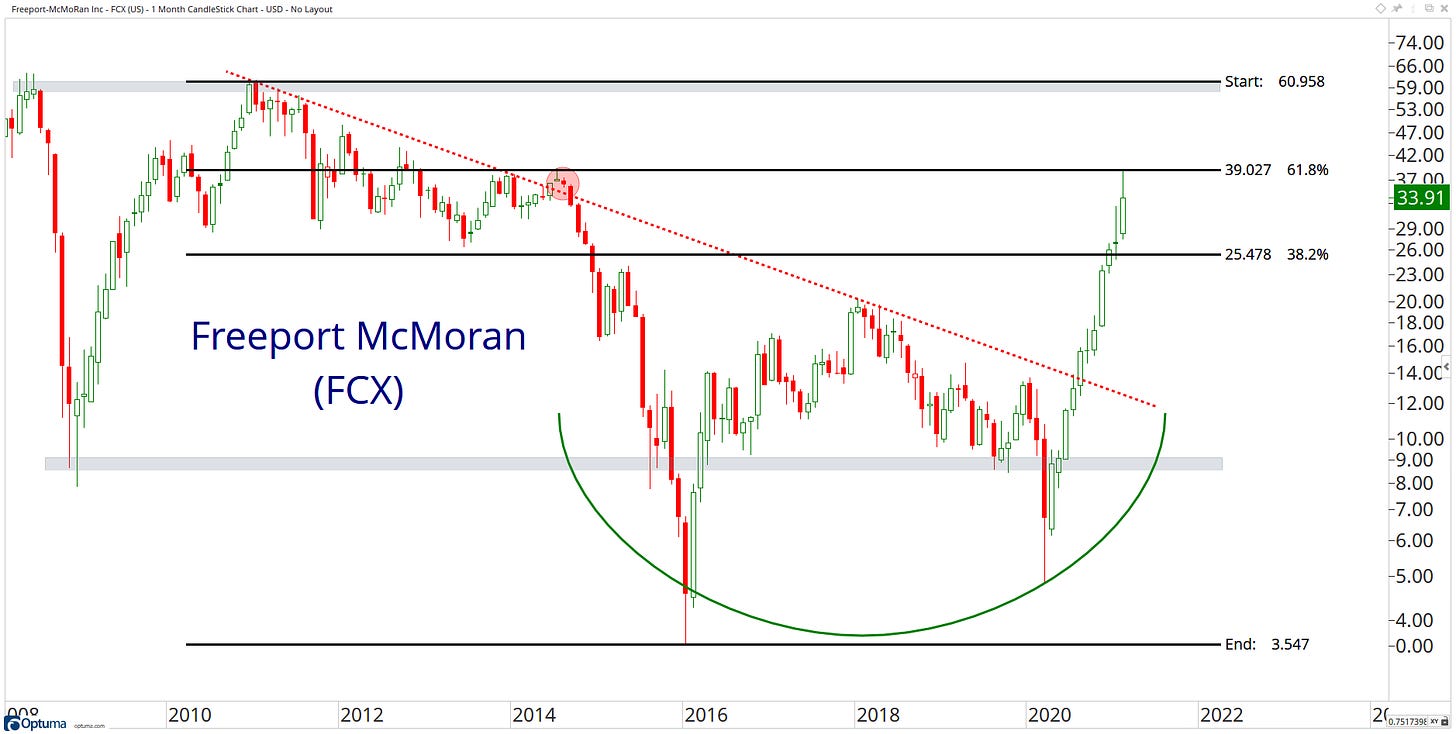
96. Freeport-McMoRan Inc - FCX
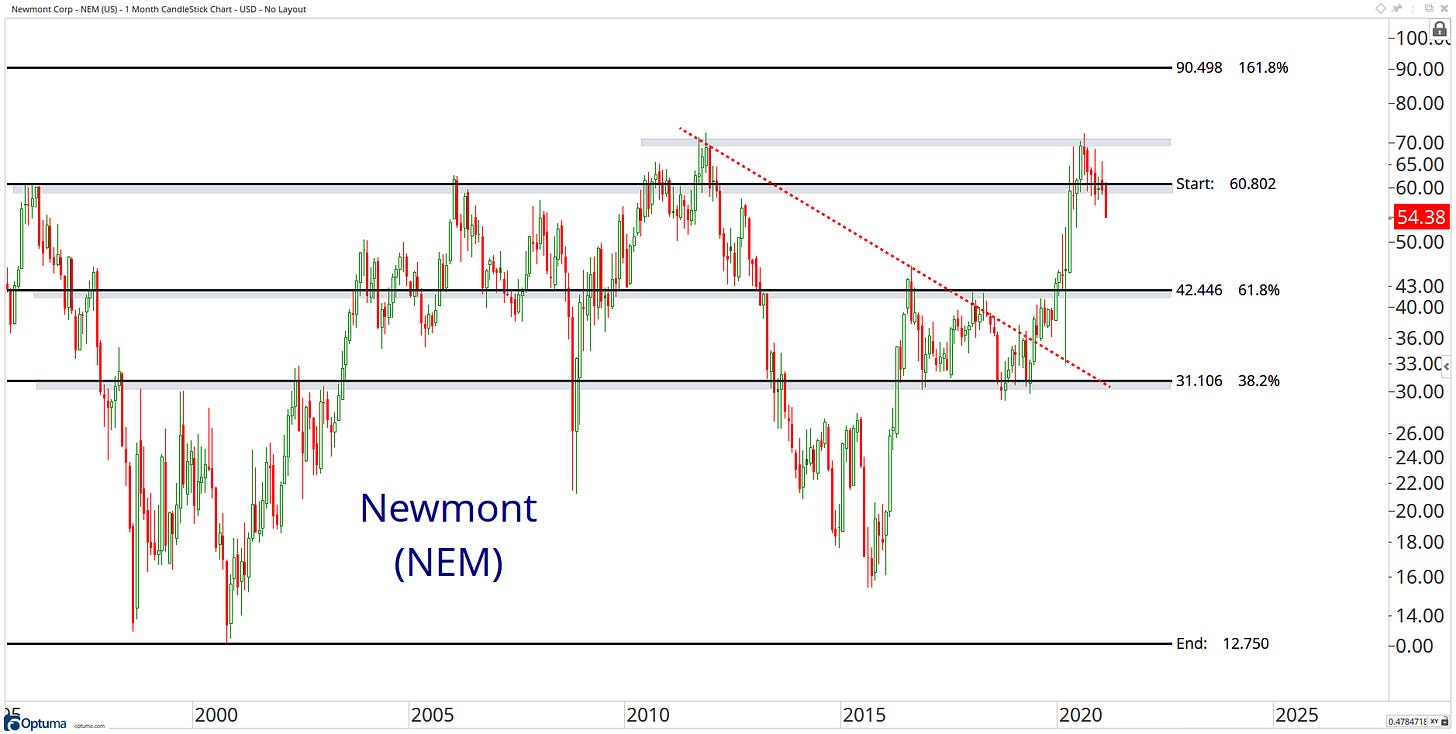
97. Newmont Corp - NEM
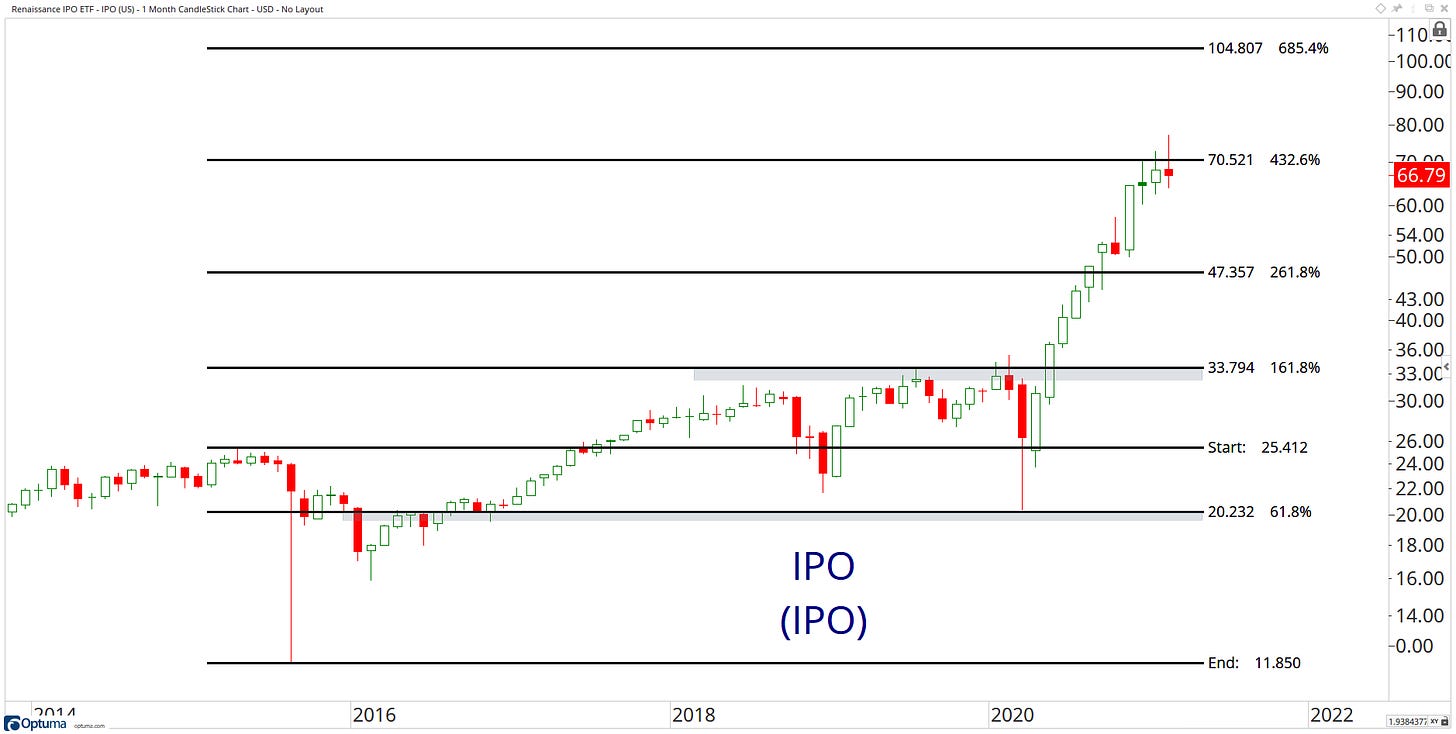
98. Renaissance IPO ETF - IPO
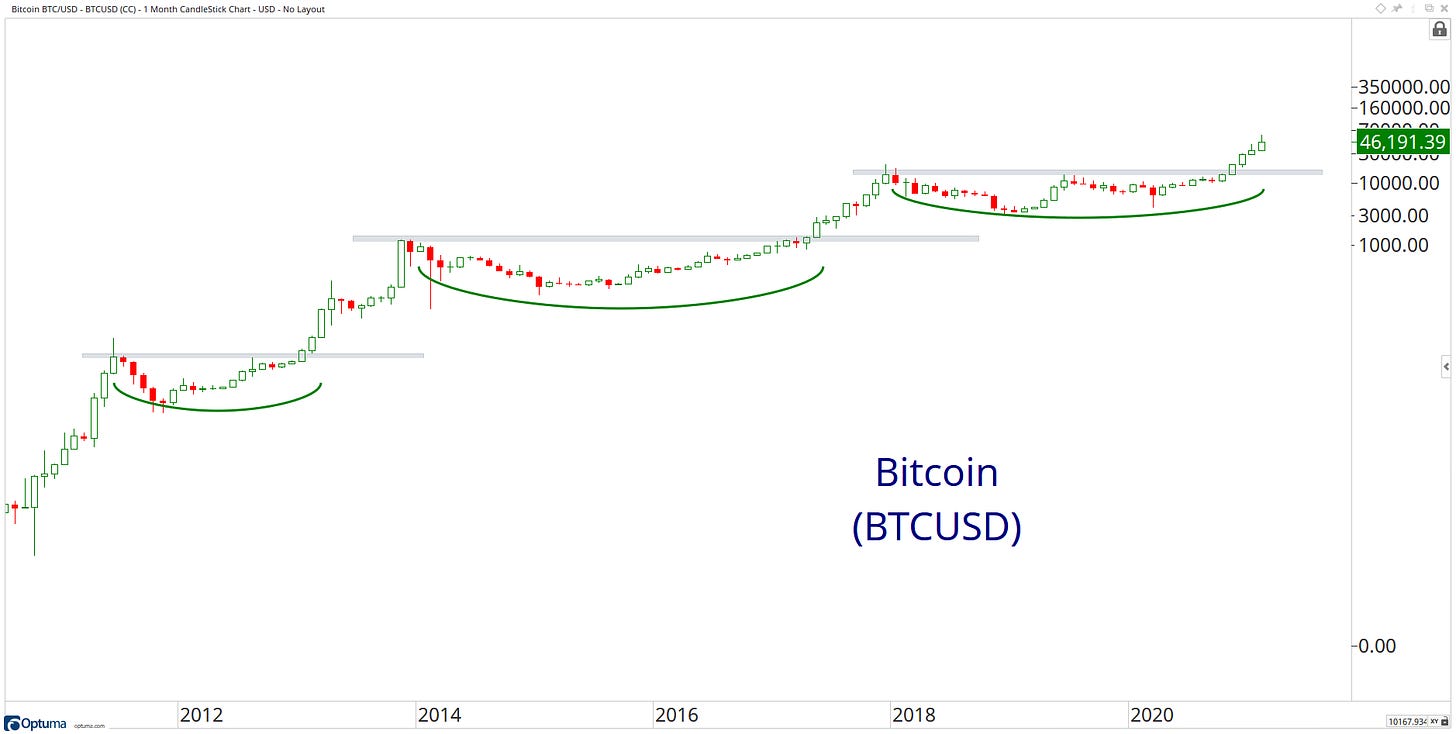
99. Bitcoin - BTCUSD
100. Ethereum - ETHUSD
My key observations I noticed from my monthly candlestick chart scan:
Major indices are at or near monthly all-time highs, Strong uptrends!
The “average” stock is at an all-time monthly high.
World (Developed & Emerging) equities are taking a leadership role.
Financial industries are breakout out to the upside. Bullish for overall markets.
Continuation of broadening participation.
Small & Mid-caps still with strong momentum.
Cyclicals over Defensives.
Rotation from Growth to Value might stick this time? One to watch!
Rising rate = Weakness in bonds
Are commodities just starting to get going? It looks like it
Gold weakness.
‘Risk-on’ currencies are outperforming, Dollar weakness continues.
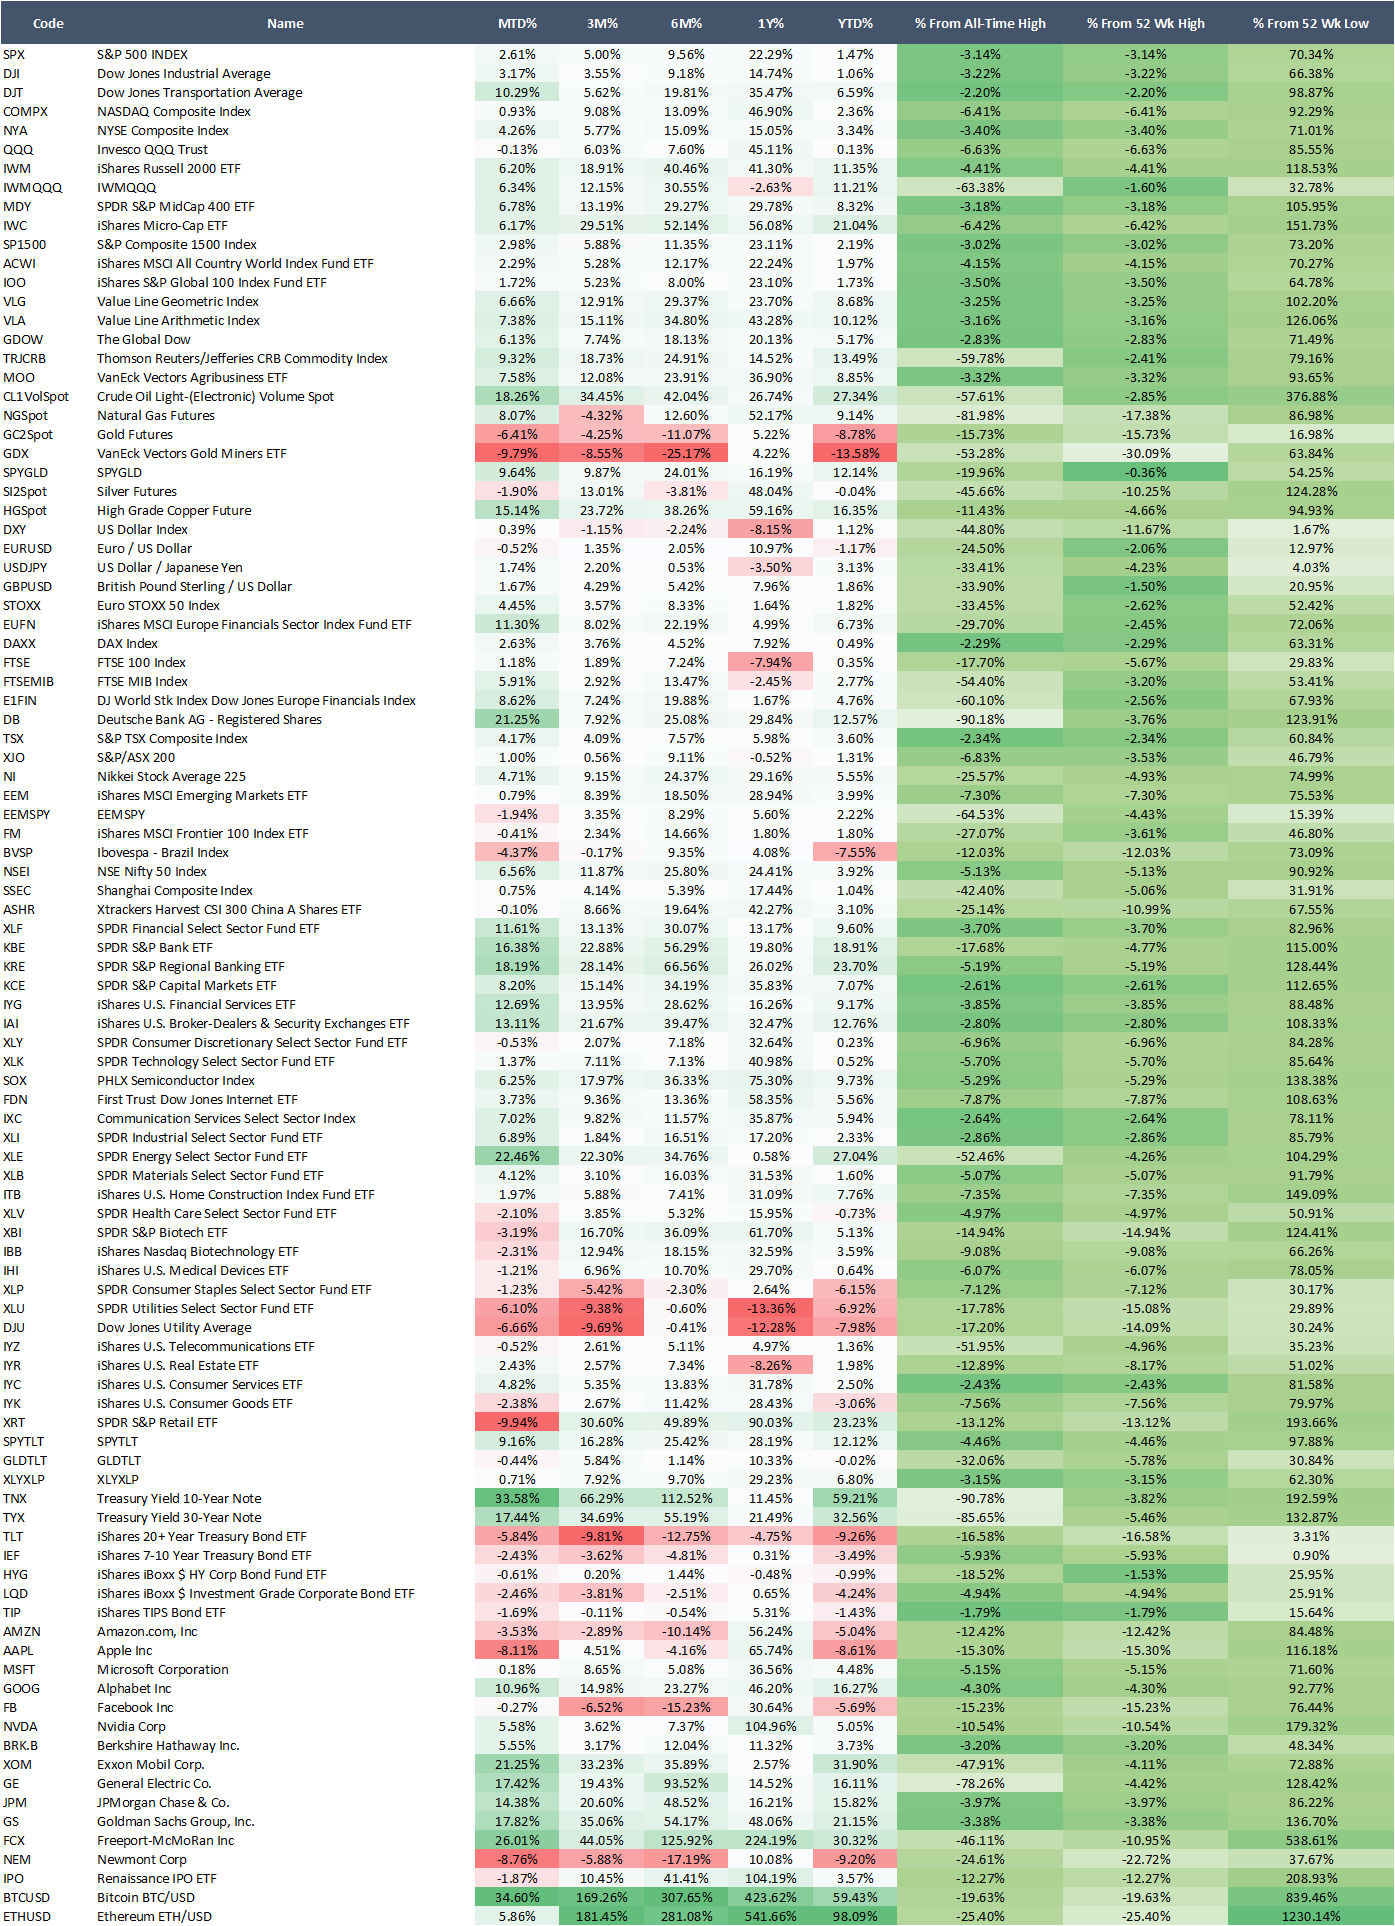
Here is the performance list of the above charts:
Alright, I have laid down the foundation. It’s now up to you to make your interpretation… you need to do some of the work too!!
What did you learn from your monthly review? Let me know!
Did you even do a monthly review?
If you need a hand setting up a monthly review, reach out to me on Twitter!
That’s a wrap for today. I hope you enjoyed my charts, and please don’t forget to share your ideas in the comment section or get in contact with me on Twitter @granthawkridge.
If you enjoyed this blog, please consider sharing for more to see!
Stay safe, and good luck out there…
GH
DISCLAIMER: The information included in this report are obtained from sources which Jo’s believes to be reliable, but we do not guarantee its accuracy. All of the information contained herein should be independently verified and confirmed. All opinions expressed by Jotting on Charts are for informational purposes only. Jotting on Charts is not a financial advisor. This does not constitute investment advice, nor any opinions expressed, constitute a solicitation of any securities or related financial instruments' purchase or sale. Jotting on Charts is not responsible for any losses incurred from any use of this information. Do not trade with money you cannot afford to lose. It is recommended that you consult a qualified financial advisor before making any investment decisions.


