Welcome to Jotting on Charts! If you're currently reading my blog but haven't subscribed yet, I invite you to join our community of over 800 subscribers. By subscribing, you'll gain access to a wealth of information on uptrends, downtrends, and everything in between.
Welcome to the ‘What happened last week?’ blog post. In this post, I will share key technical data tables for various asset classes and categories. Each table will be accompanied by a key chart and some short commentary.
Current Environment
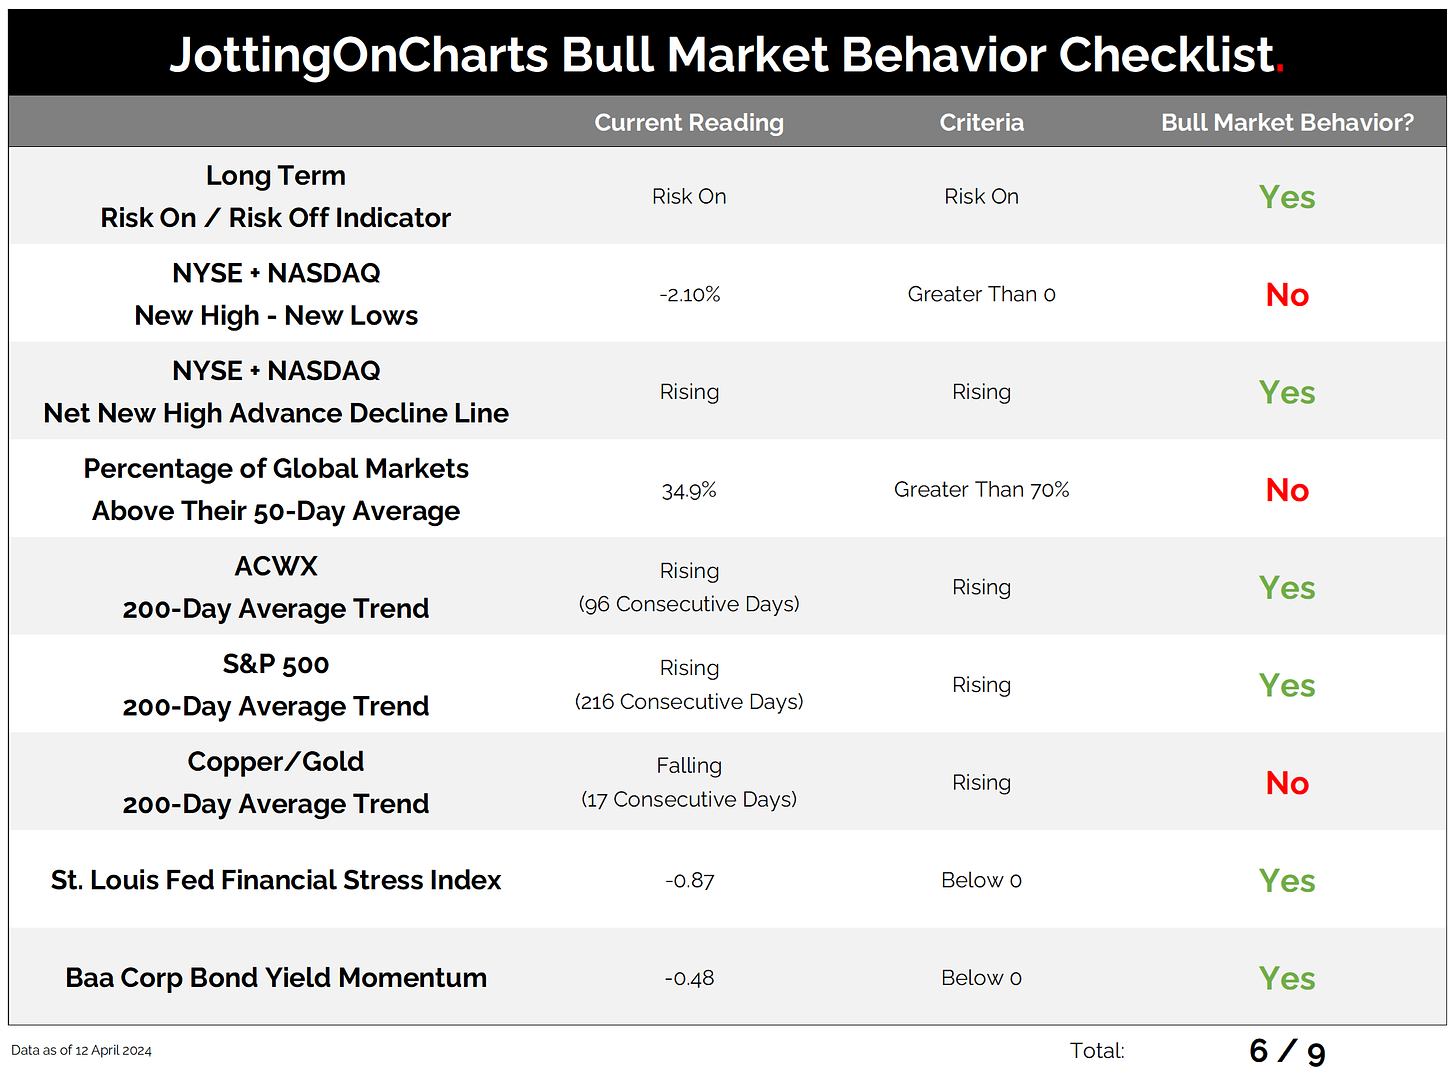
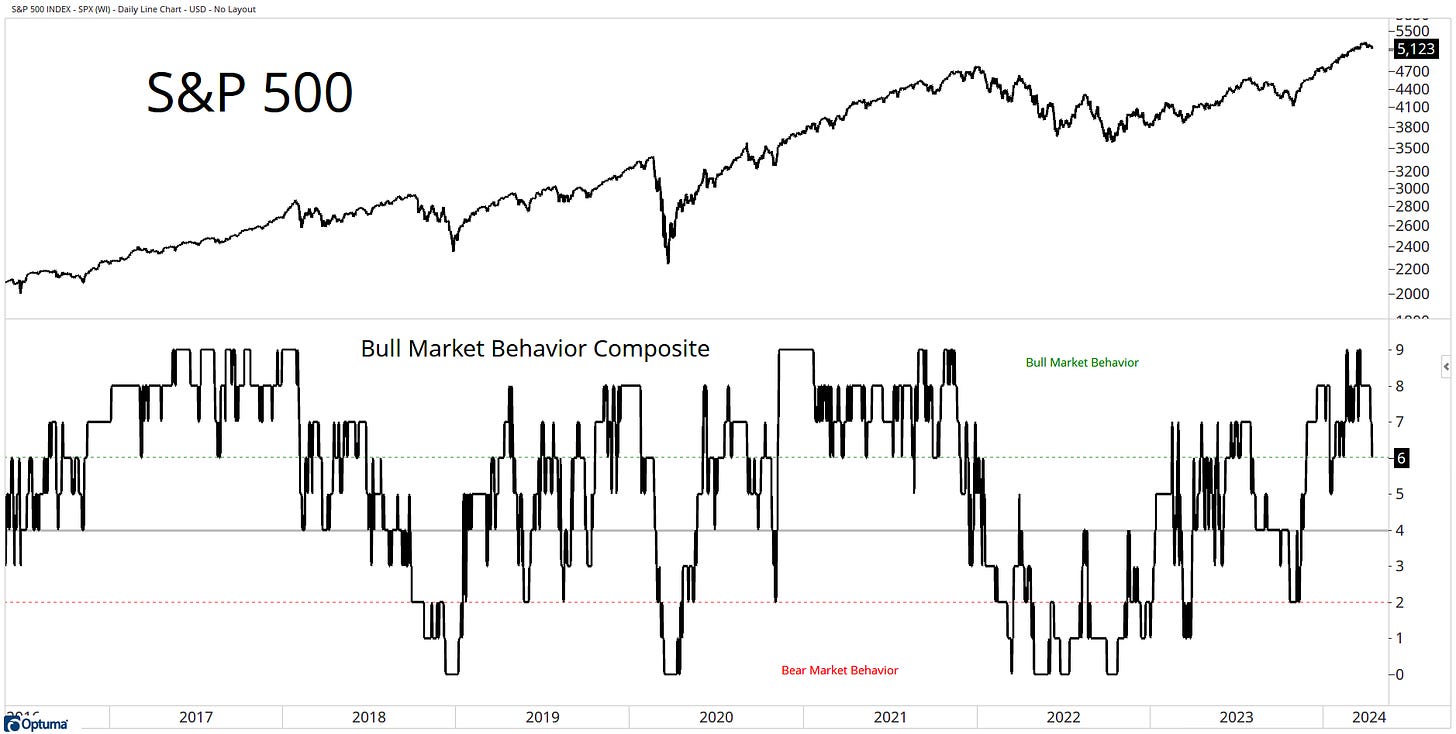
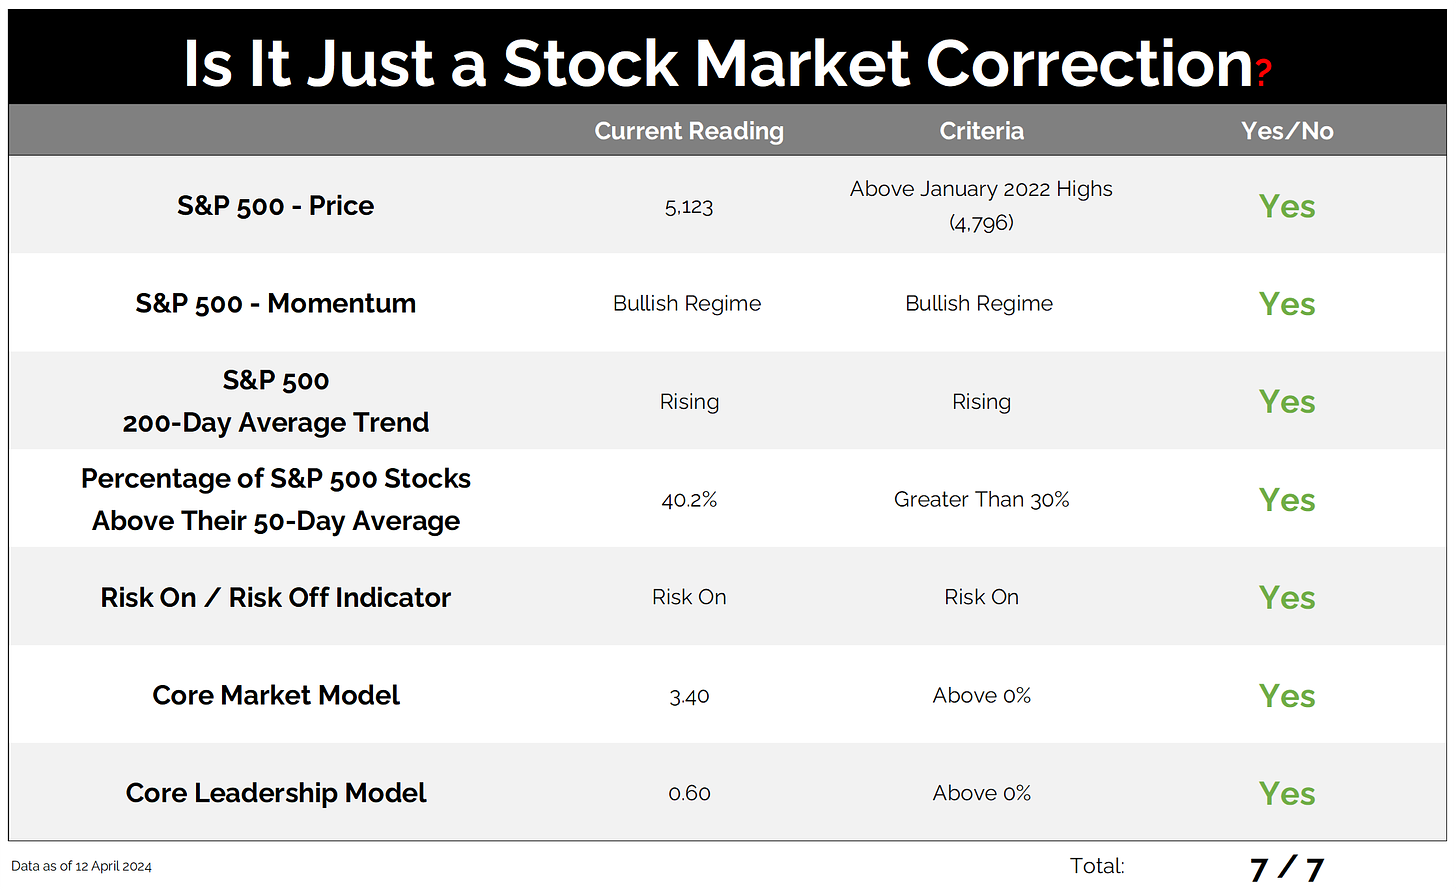
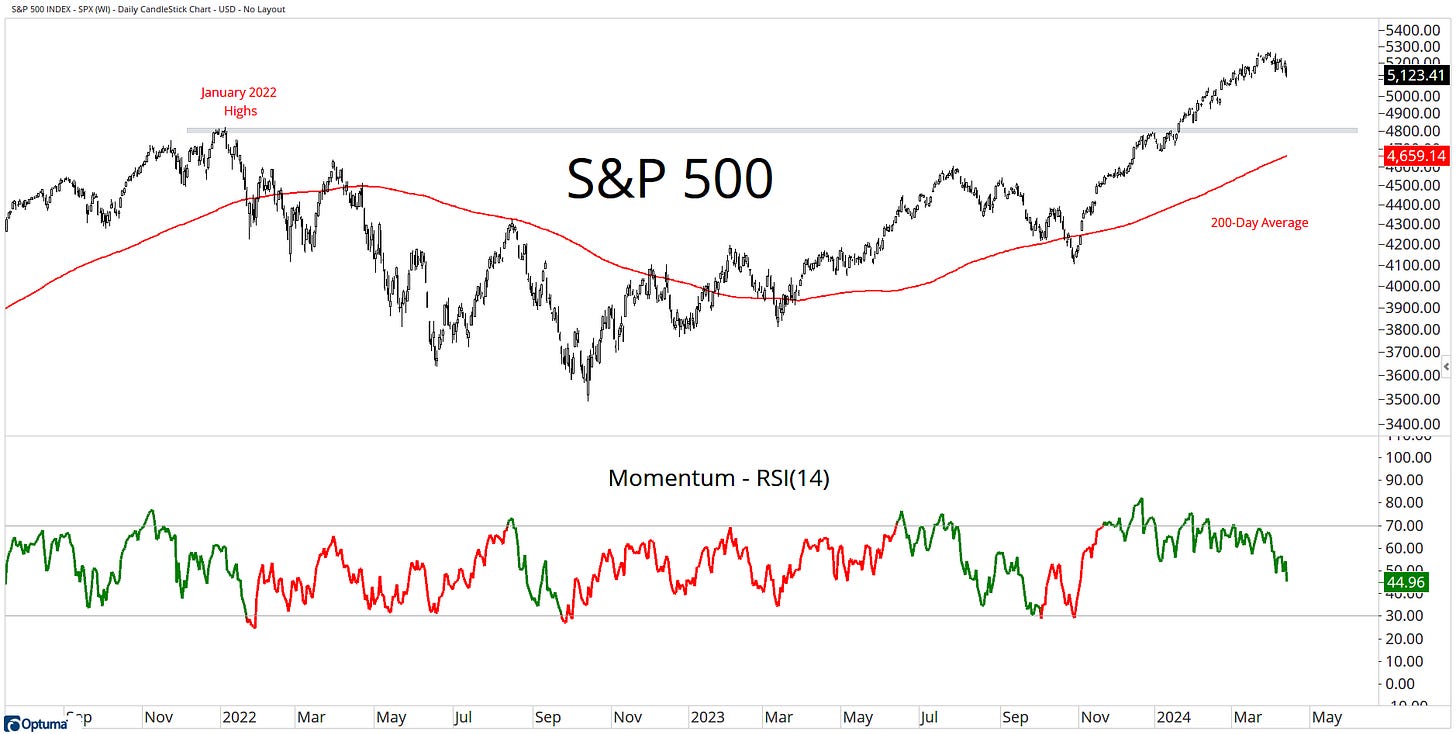
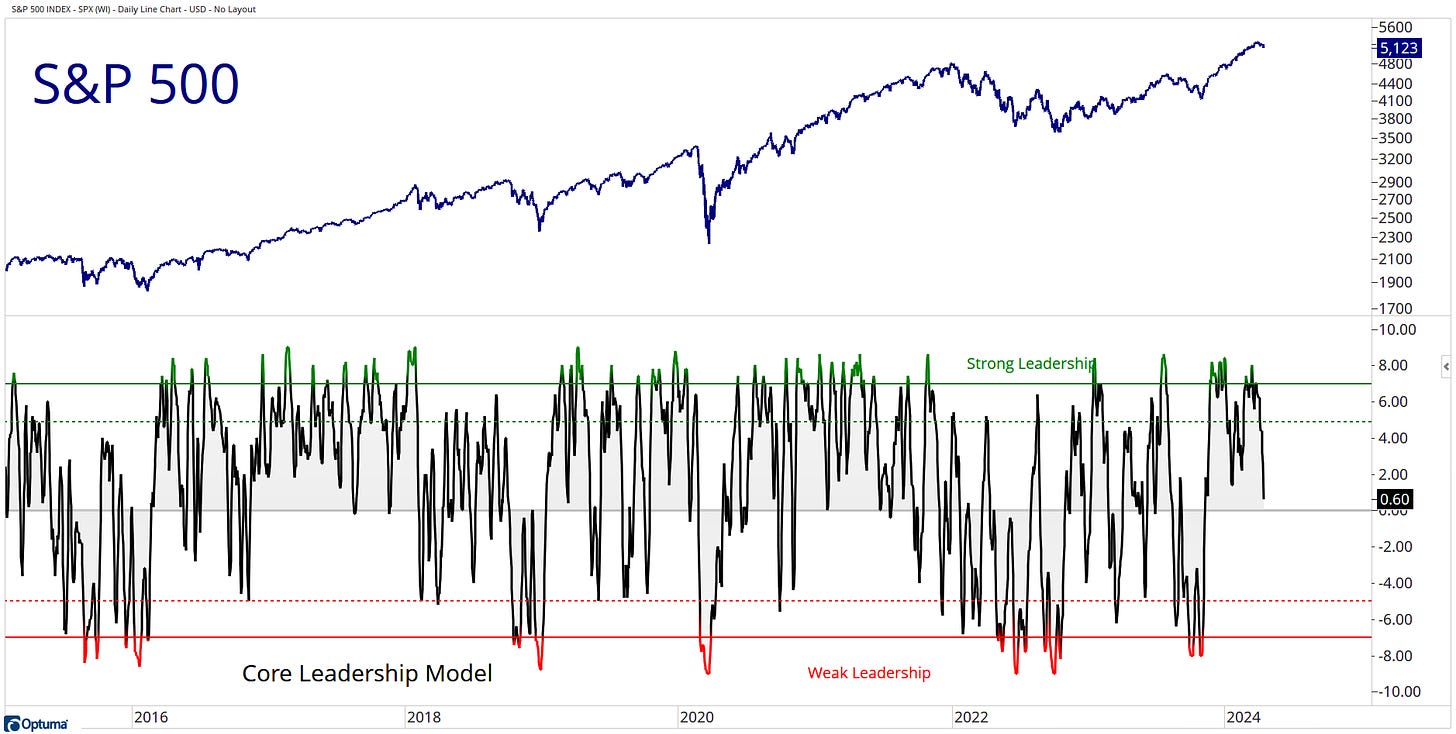
The Bottom Line: I'm concerned about the recent pullback in stocks as my bull market checklist has dropped to 6 out of 9. This makes me question whether it's just a correction or going to be something more significant. As a result, I've decided to switch my thinking and have created a new checklist - the 'Is It Just a Stock Market Correction' checklist. Currently, we are 7 out of 7 on this new checklist:
Here are the charts that accompany the new checklist:
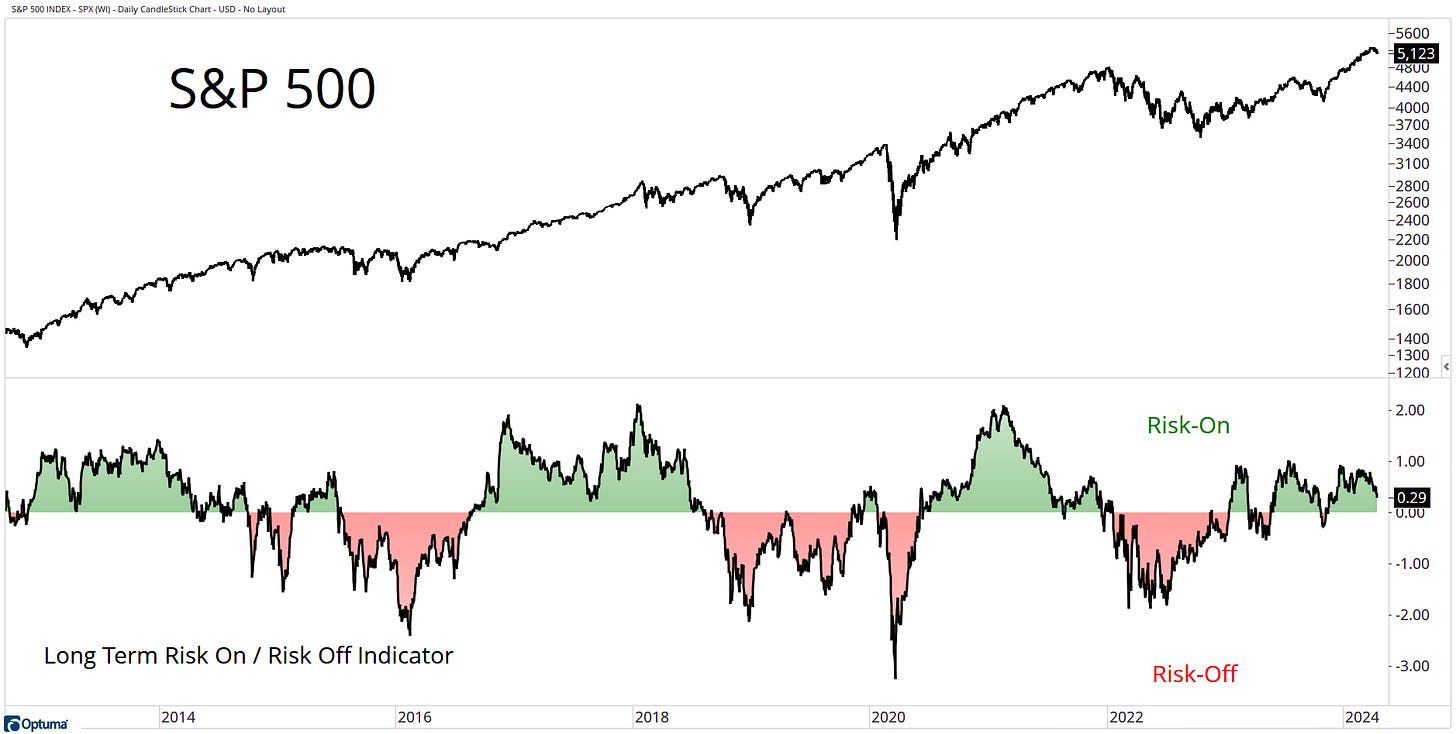
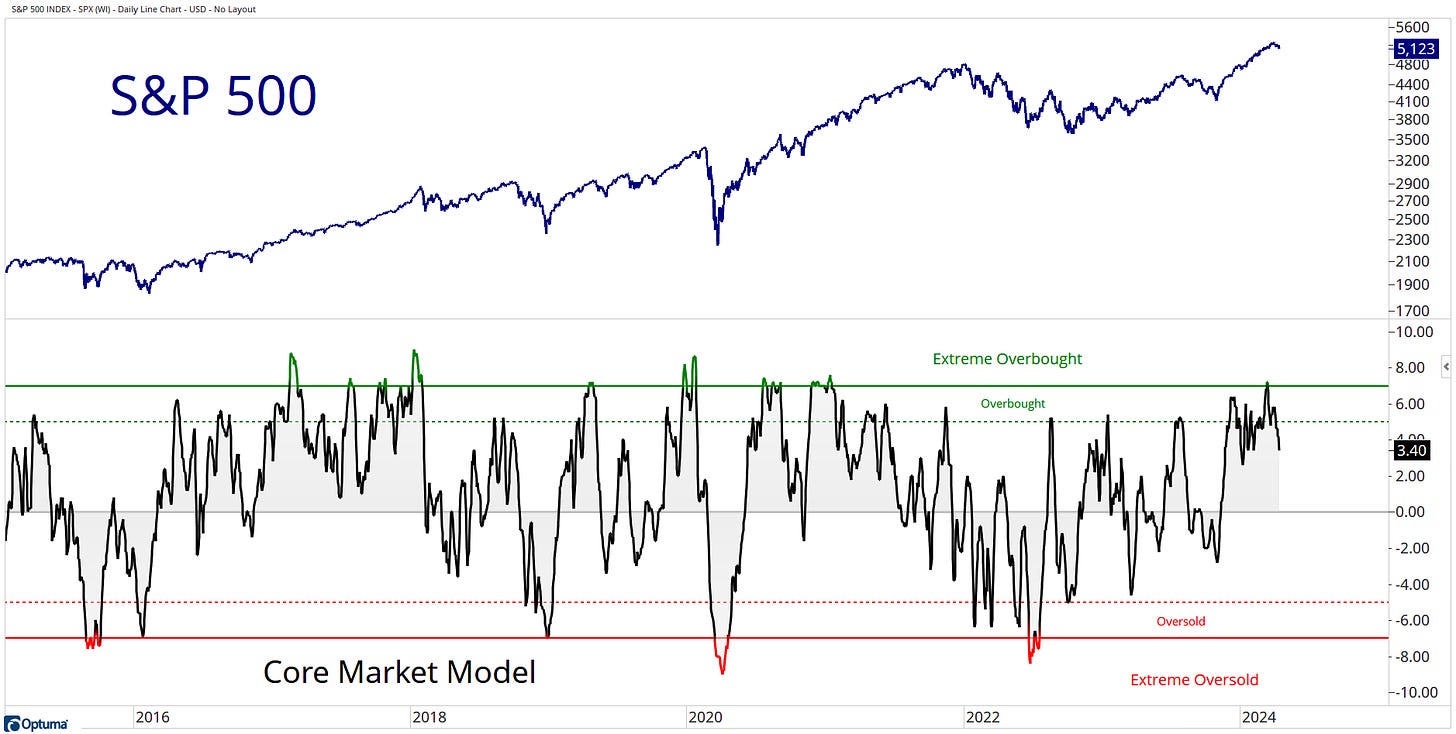
The Bottom Line: The bears have the bulls on the ropes here; this is something I watch every day, and I will inform you of any changes we have on this checklist.
You can read more here about the risk-on-risk-off indicator, core market model, and leadership model.
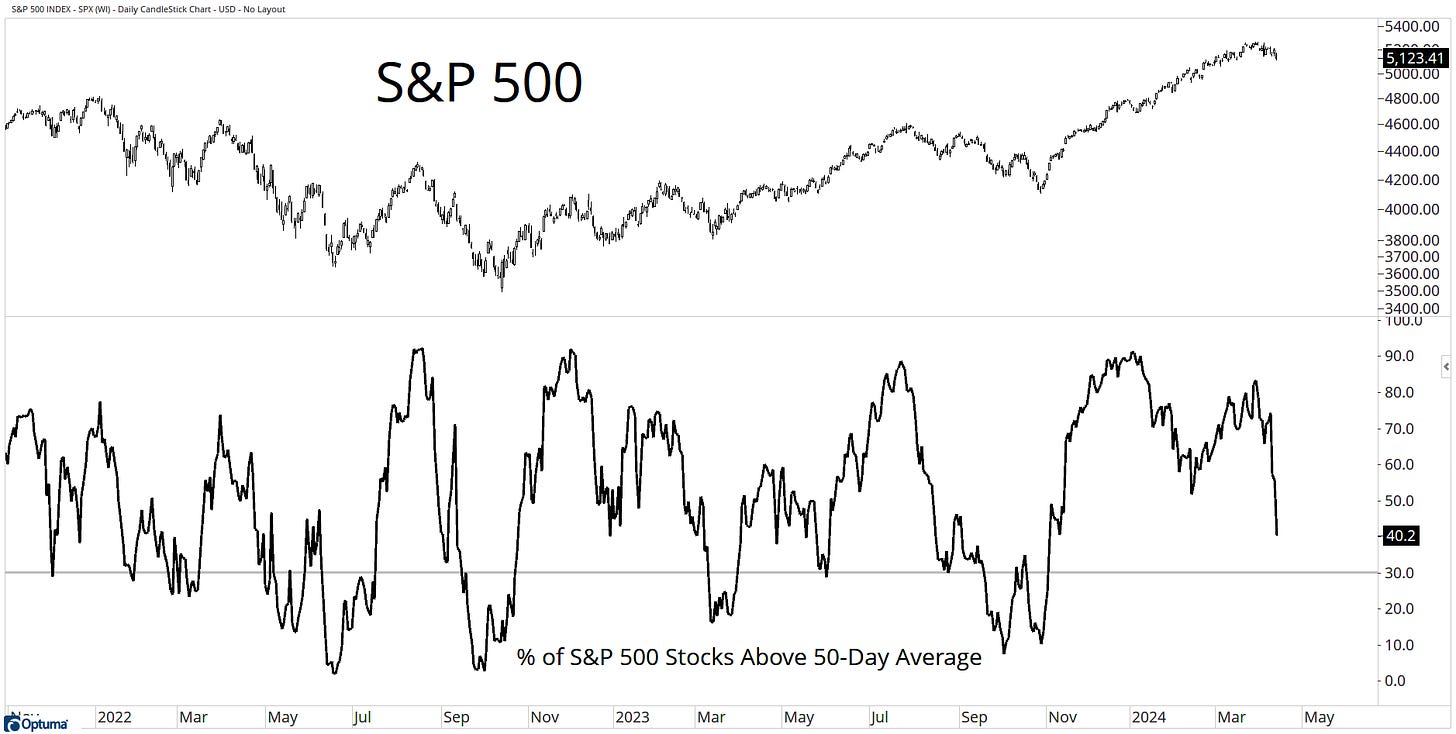
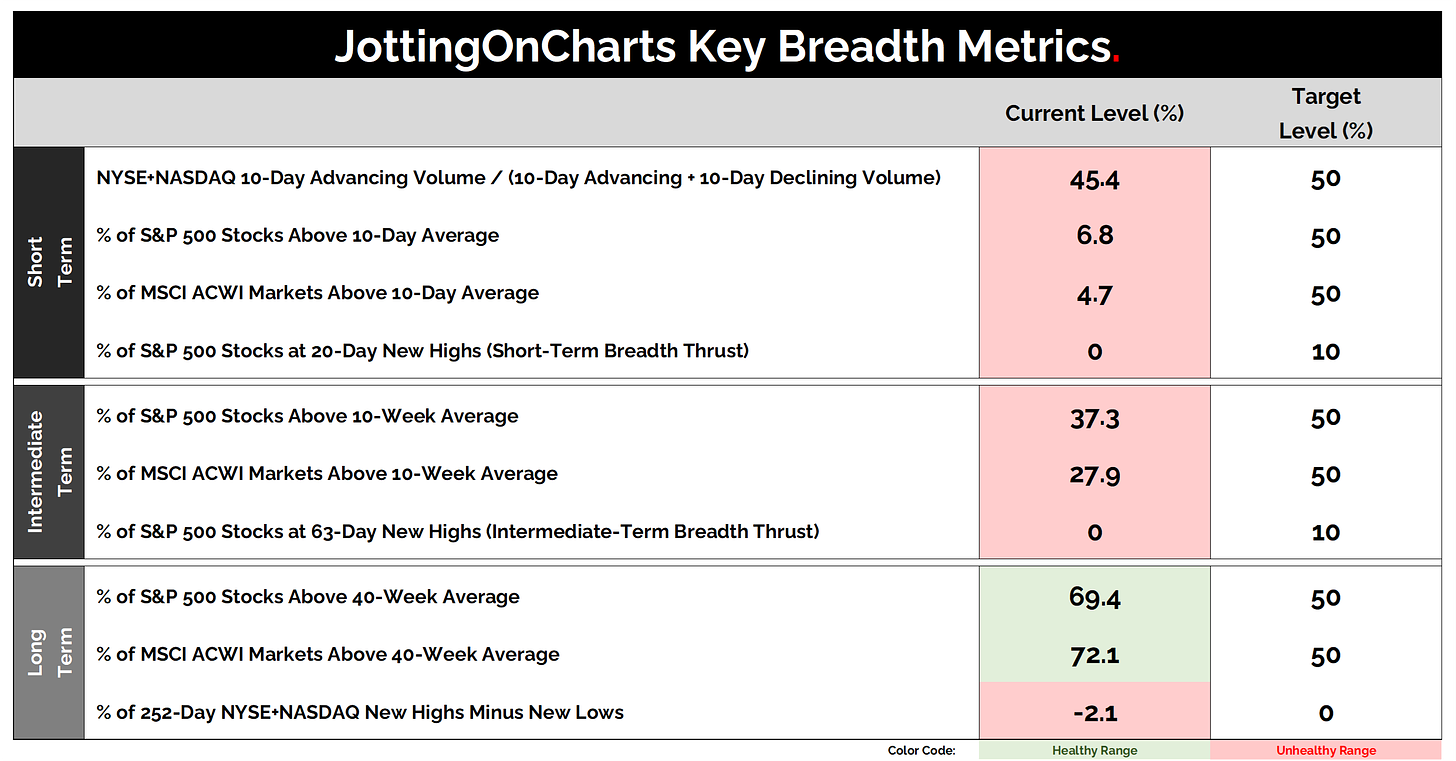
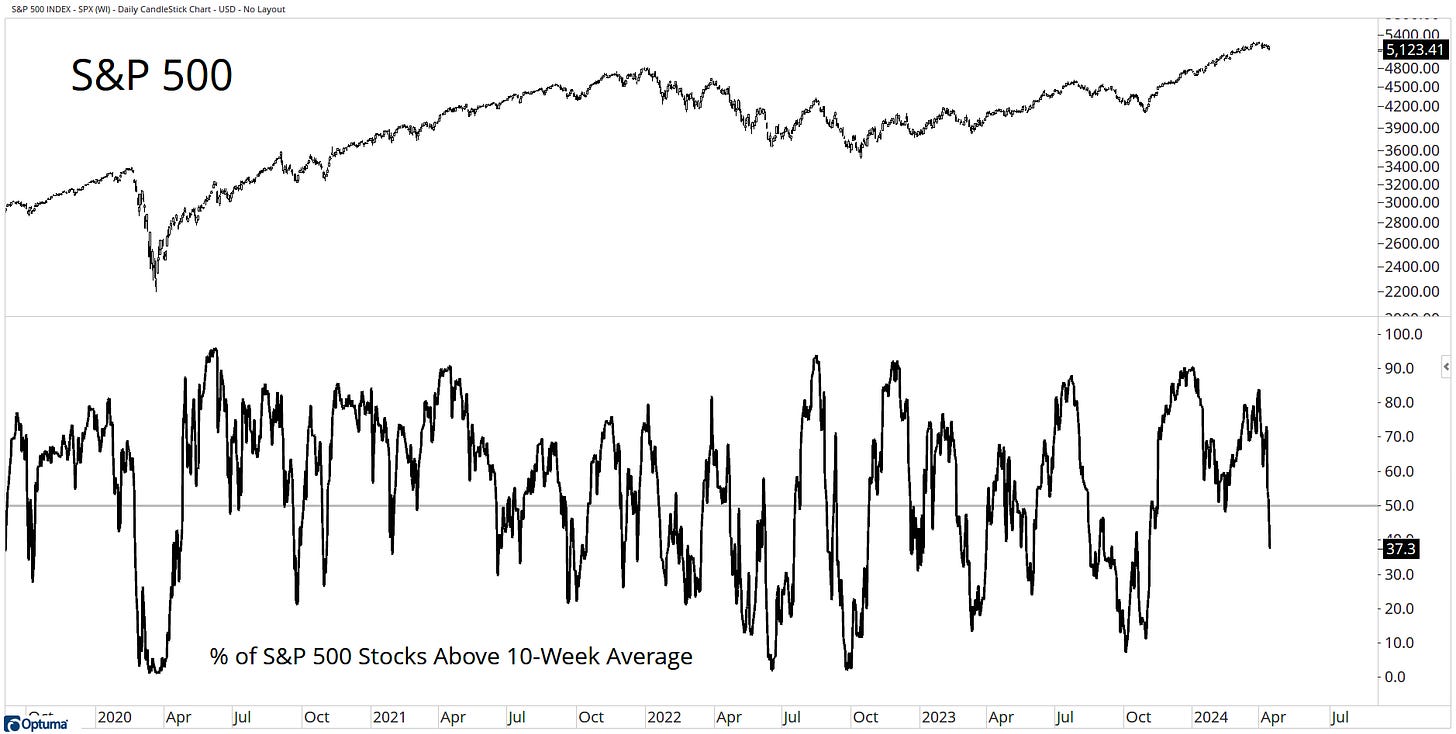
Current Breadth
The Bottom Line: It appears that the recent weakness in short-term market breadth is now starting to affect the intermediate term as well. This time, the situation seems different from before. Although the Bears have had some one-day wins, they have not been able to follow up with consistent consecutive days of selling pressure. However, they seem to be gaining momentum and putting pressure on the Bulls, who are now on the defensive.
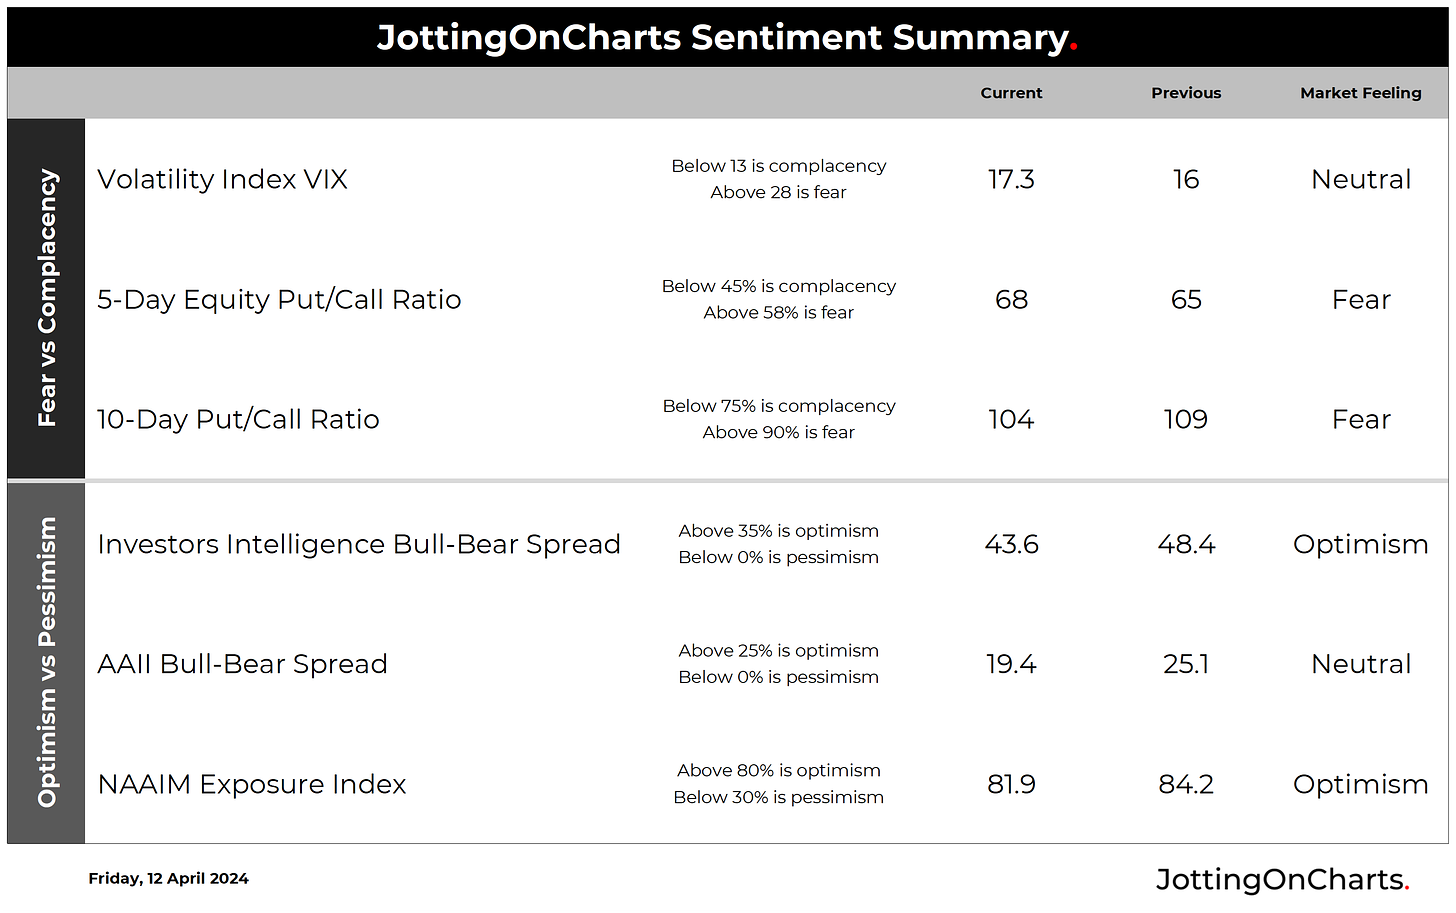
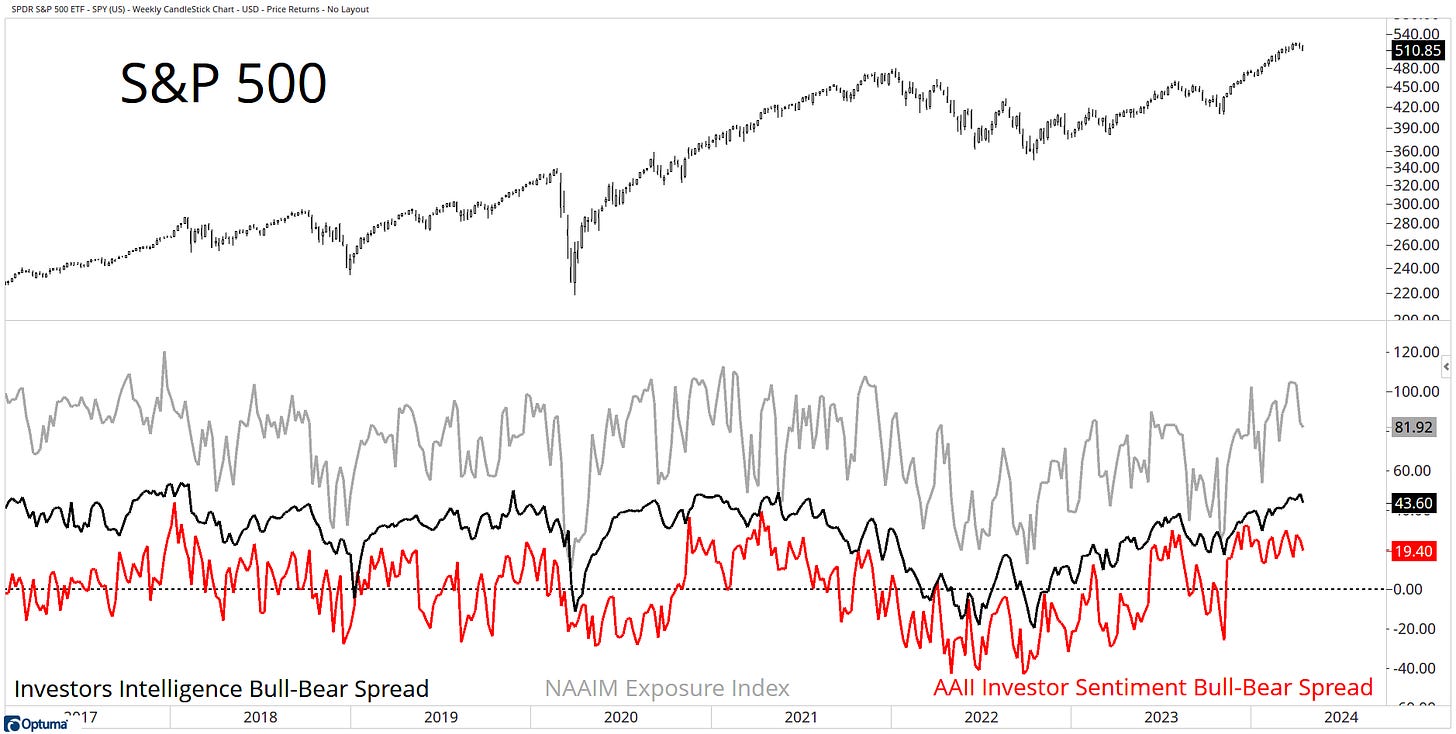
Current Market Sentiment
The Bottom Line: The evidence suggests that we have begun to pull back from excessive optimism, but is this just a much-needed reset that will allow optimism to grow again as we move forward? If we continue to see the weakness build beneath the surface and we lose the supportive environment, a correction in prices could result in a more significant decline in sentiment.
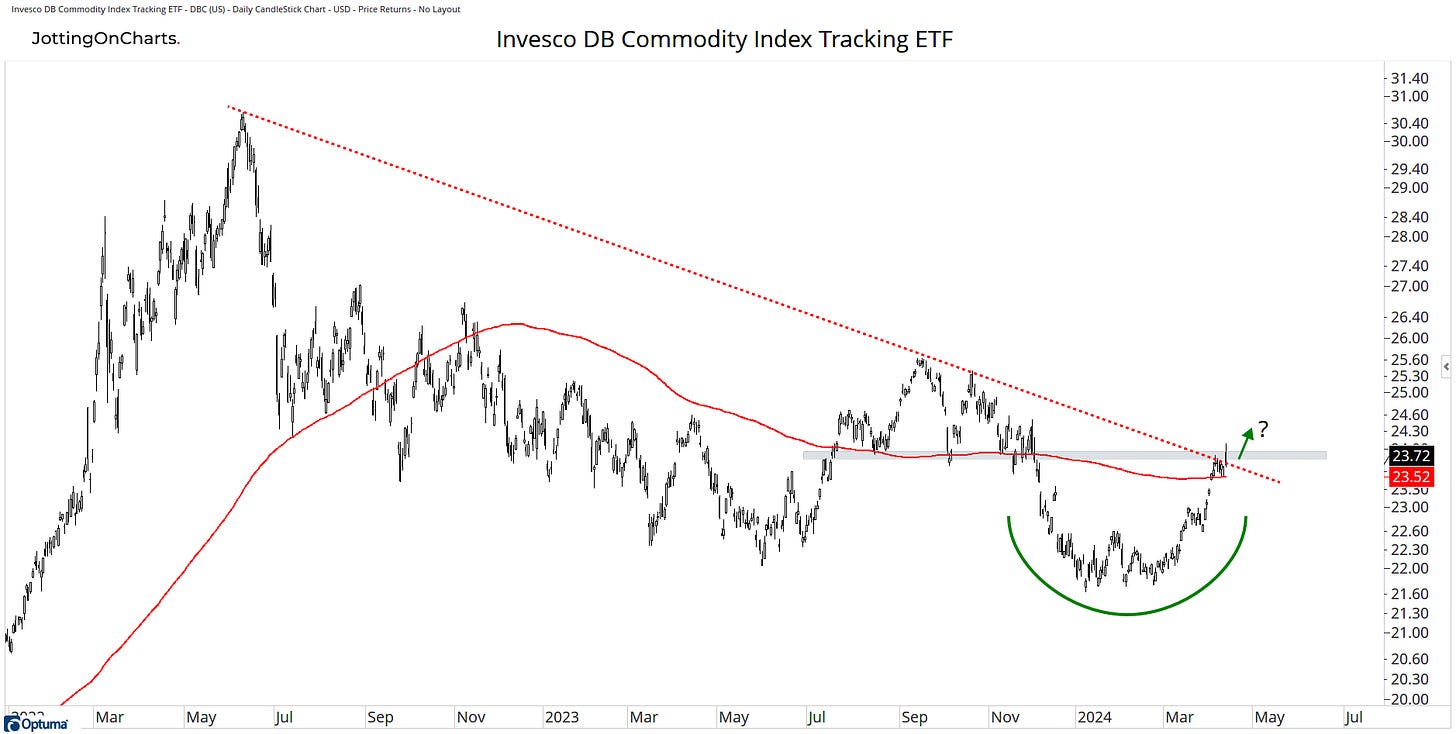
Asset Class
What Stood Out: Is something happening in commodity land?
- Price has broken above a 22-month downtrend line.
- Price looking to break above a key support and resistance level.
- Price above the 200-day average.
- The direction of the 200-day average has begun climbing.
Most investors missed the 2020 to 2022 move higher, and commodities are still under-owned by investors.
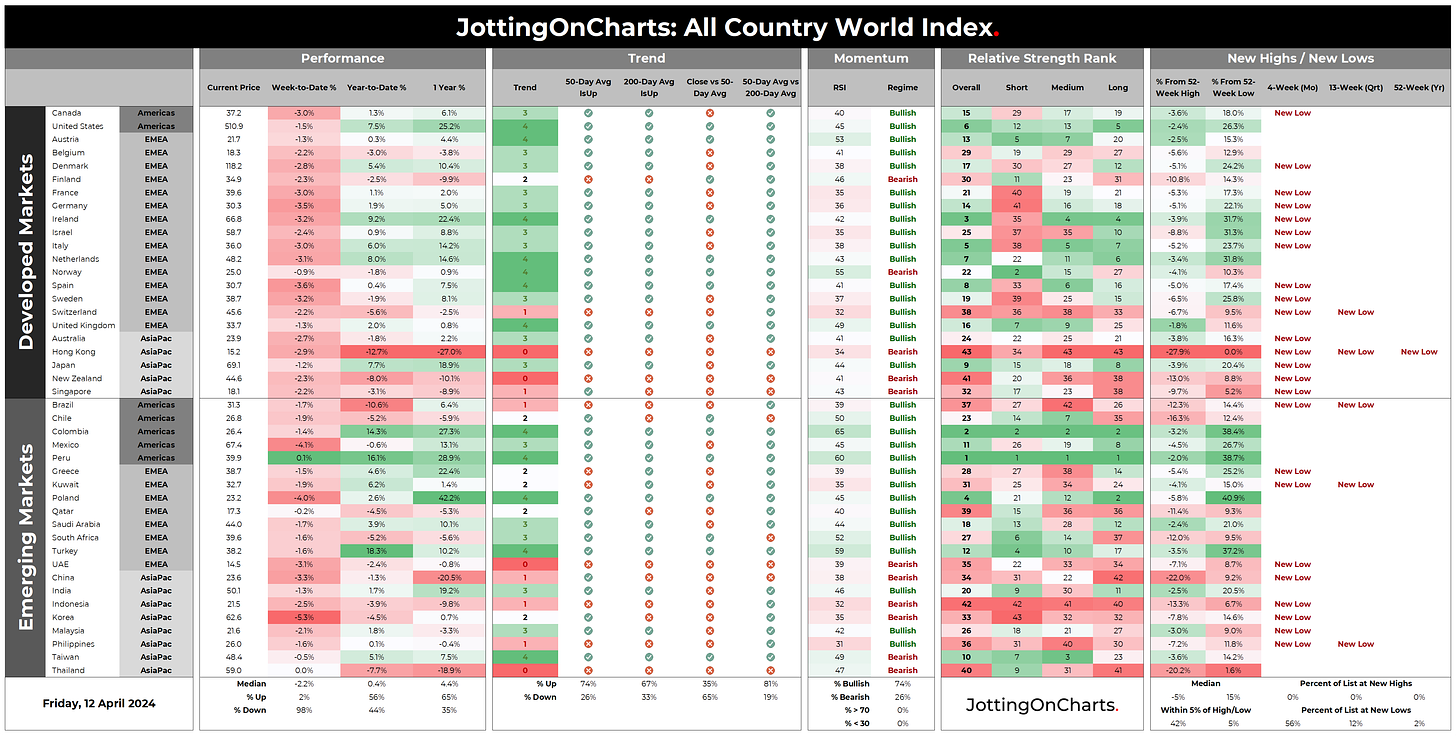
Global
What Stood Out: Hong Kong looks ugly, with a massive topping pattern, and its price closed last week at 12-year lows.
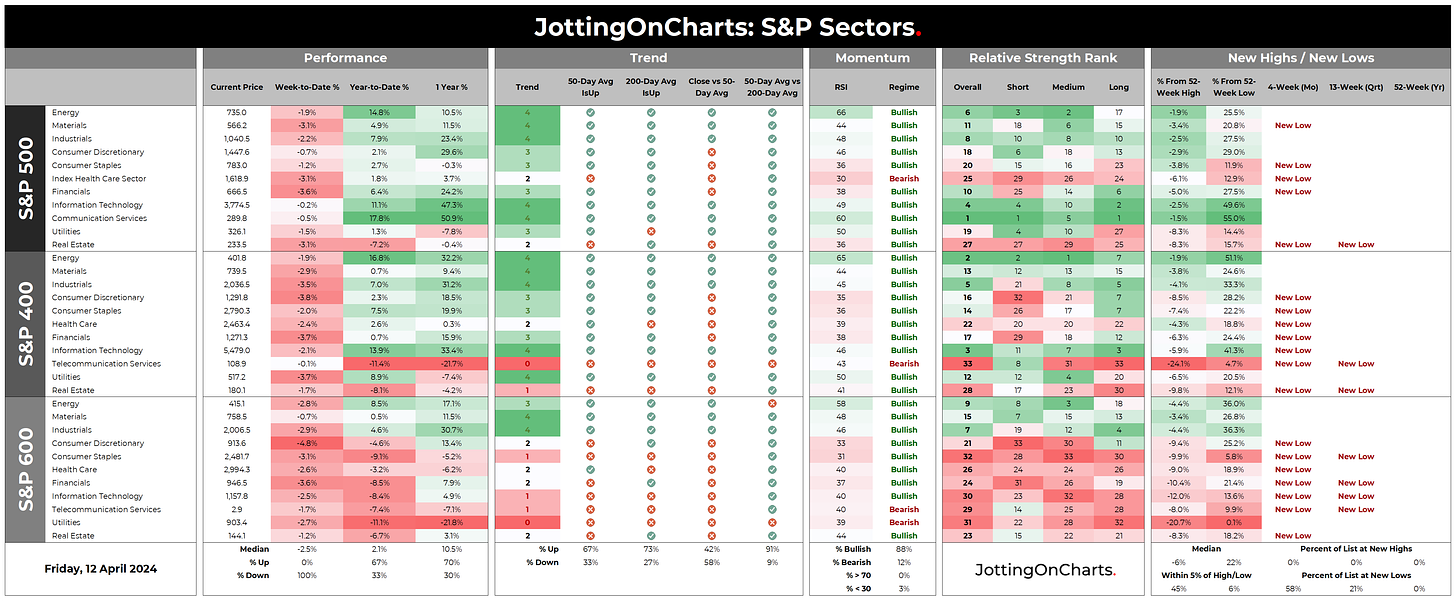
S&P Sectors
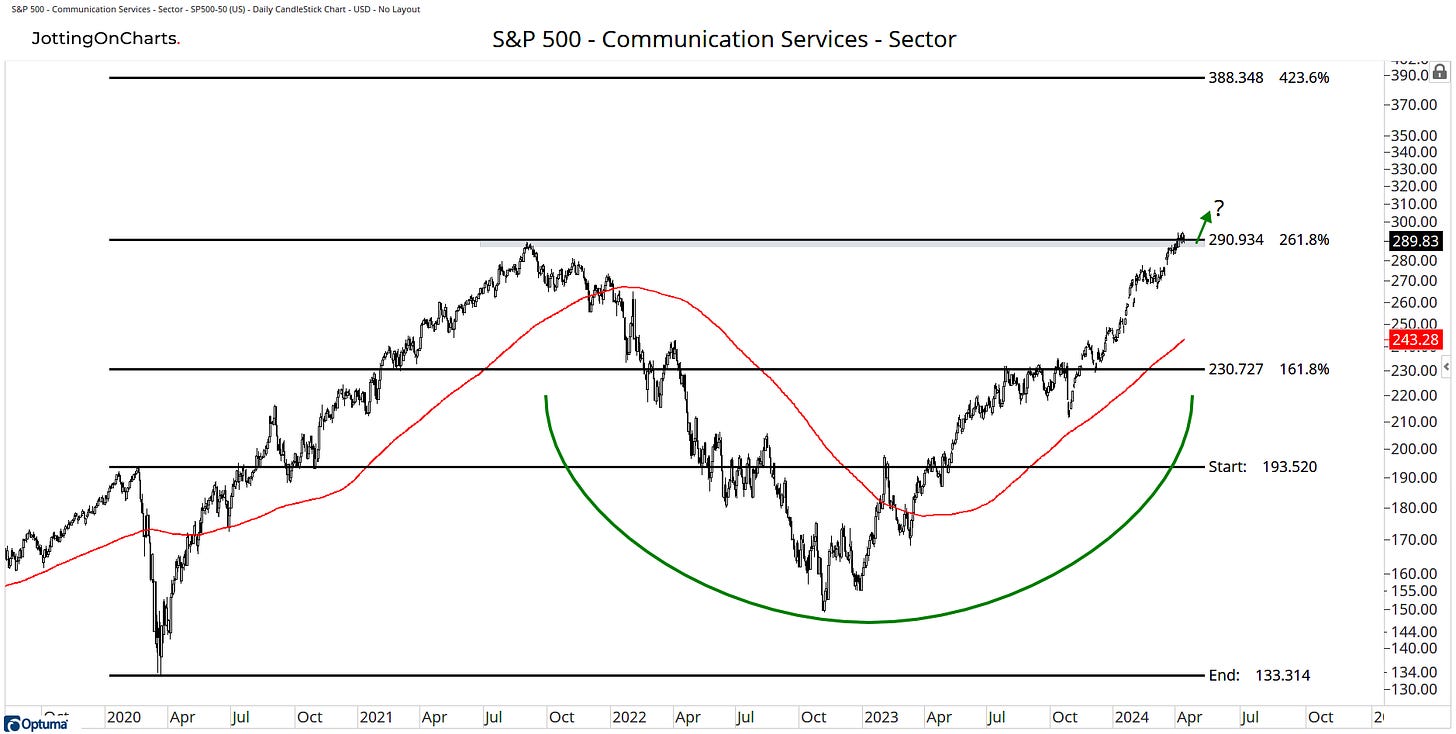
What Stood Out: S&P 500 communication services has finally made it back to its prior cycle highs from 2021. Will buyers push this sector higher?
S&P Industries
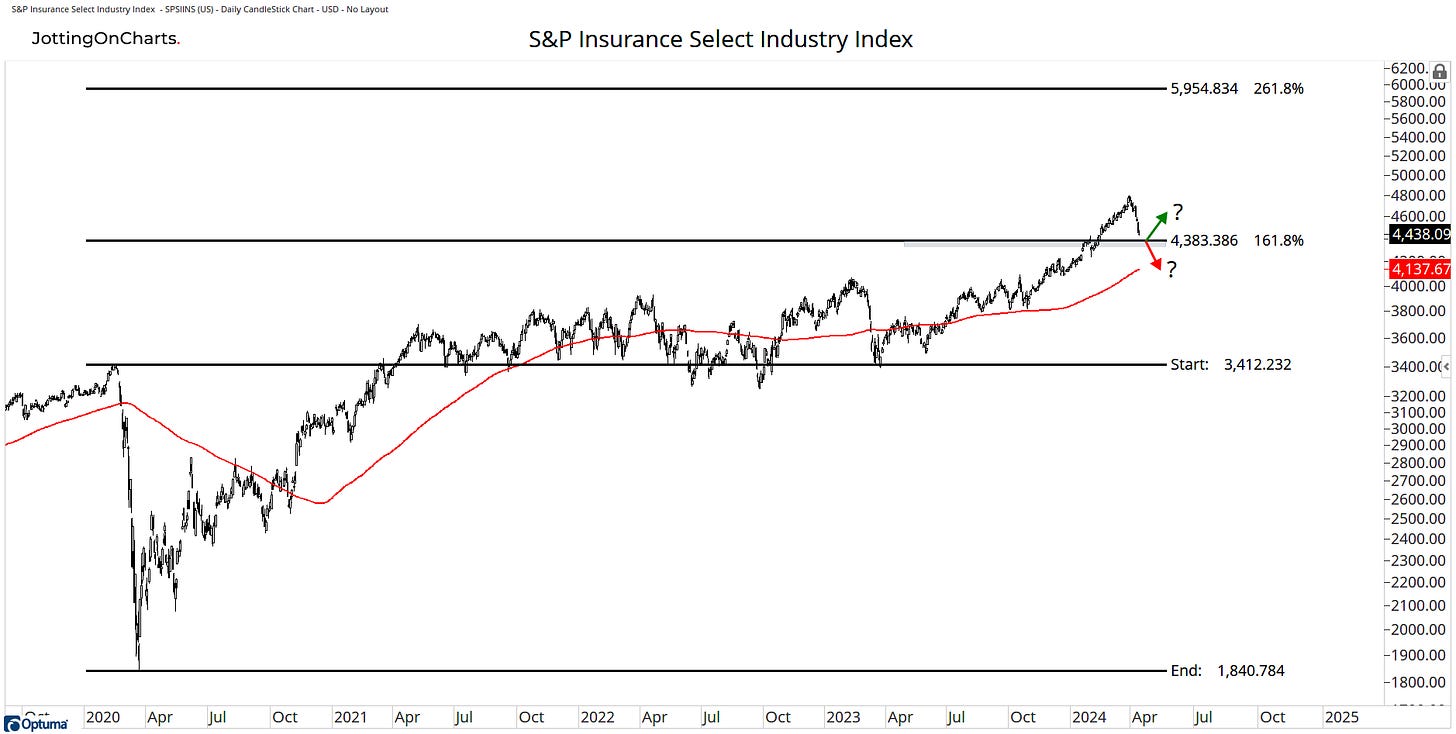
What Stood Out: The insurance industry recently hit a new record high, but very quickly, it has fallen back to that level. The question now is whether we will see a successful retest or a failed breakout move. As of now, the insurance industry is still trading above the breakout level, so it's up to the bulls to determine the outcome.
Factor Style
What Stood Out: High Beta breaking lower would be consistent with a much-needed correction for the overall market. We are witnessing similar signs of weakness in other risky assets and indicators. So will we see a retest-and-go or a failed breakout?
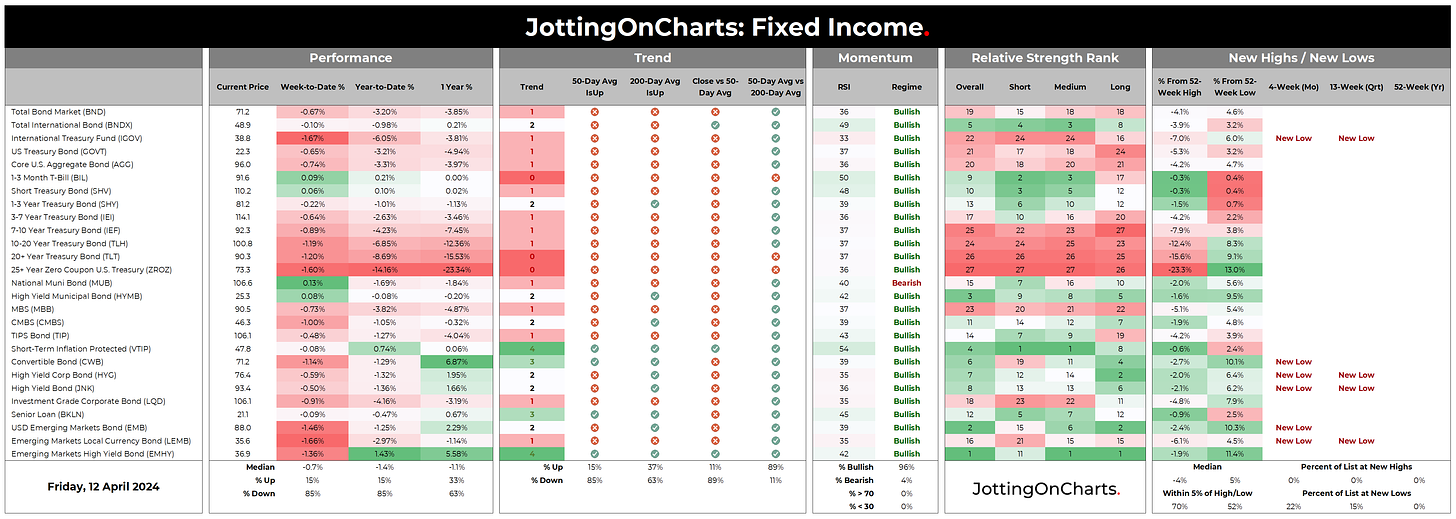
Fixed Income
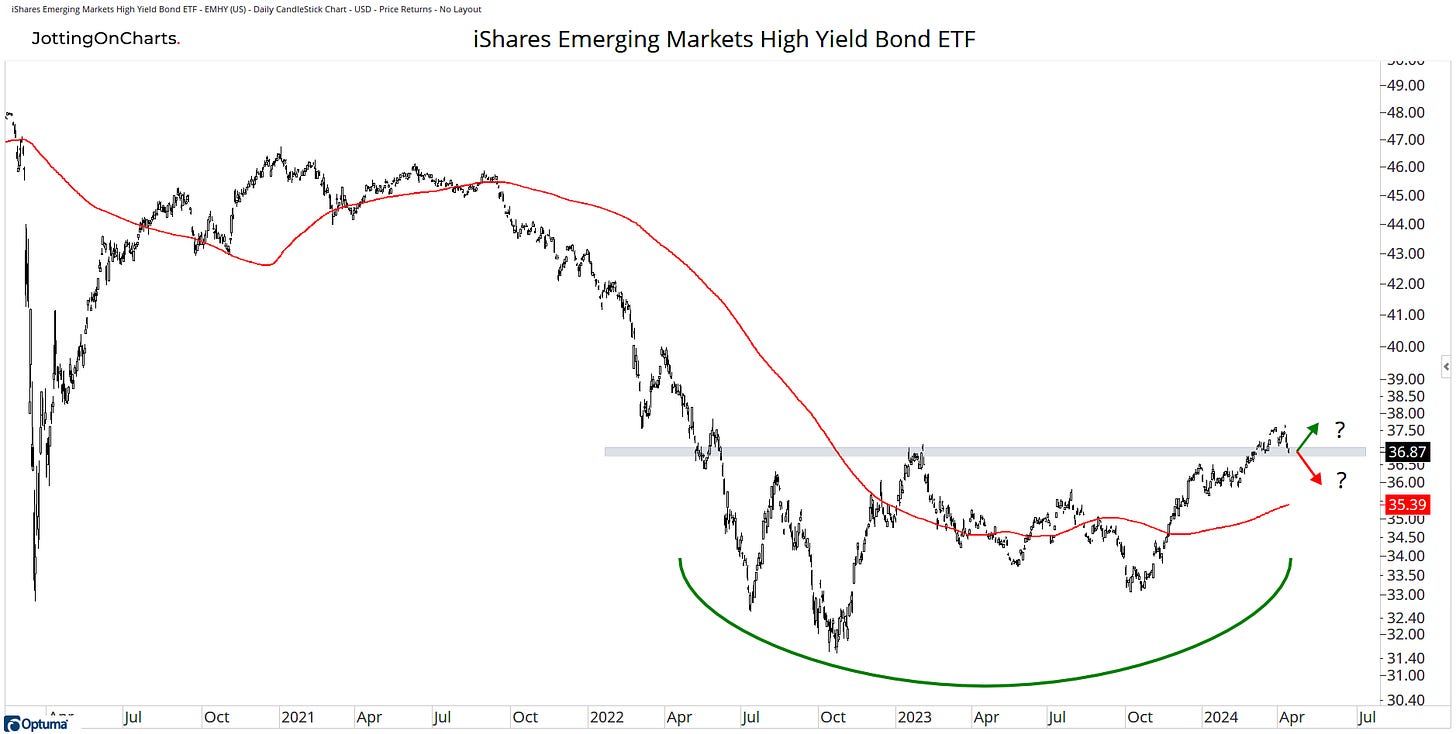
What Stood Out: Will the recent pullback in the EM high-yield bonds to its base breakout level result in a bounce-and-go scenario, or will it be a failed breakout leading to the continuation of the primary downtrend that has been in place for the past decade?
Currencies
What Stood Out: The USDJPY's upward trend continues to show strong momentum, with the currency pair achieving fresh multi-decade highs at the end of last week.
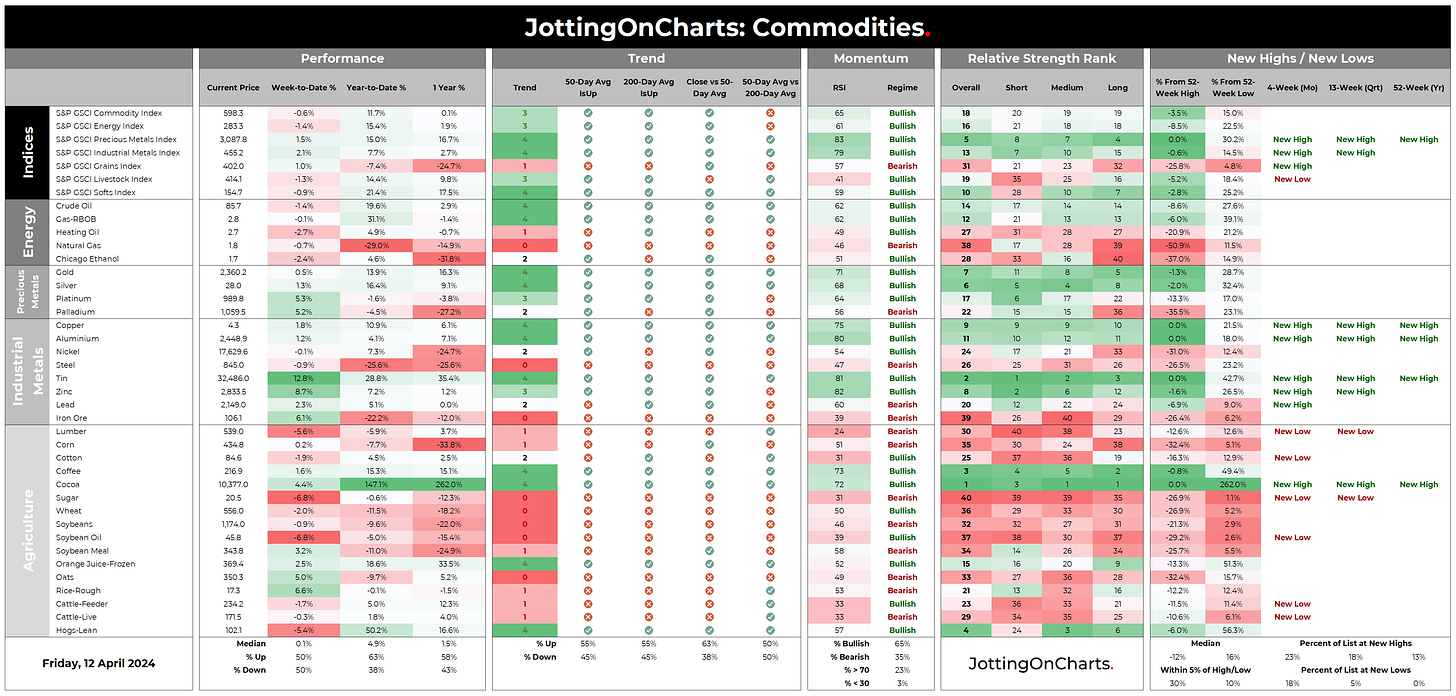
Commodities
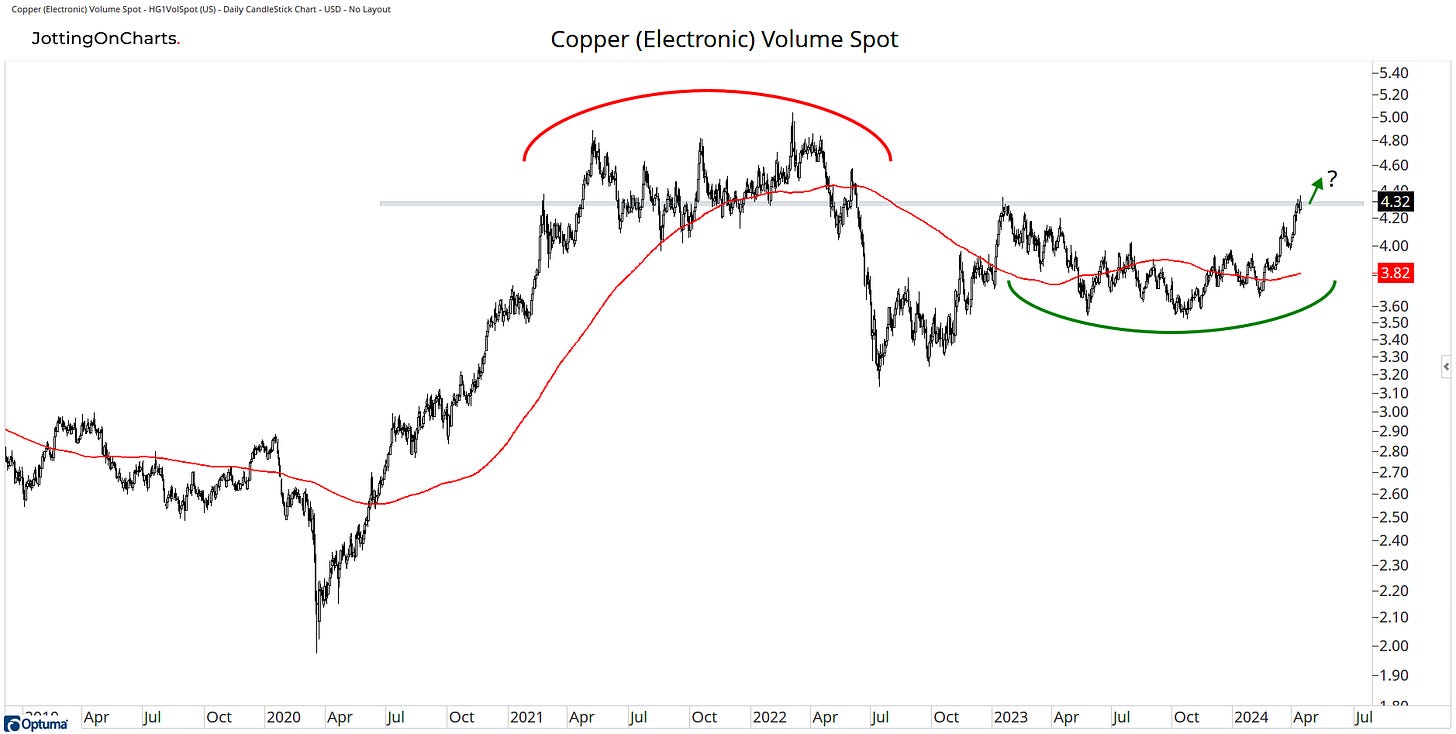
What Stood Out: Will copper breakout of this bearish-to-bullish reversal pattern? If yes, copper will be looking at retesting its March 2022 high of around $5.
Before I finish up, always remember:
Remain flexible.
We can only work with the information that is available today.
Keep an open mind.
“I can't change the direction of the wind, but I can adjust my sails to always reach my destination.” — Jimmy Dean.
I want to take a moment to thank everyone who has been following along with me on this journey. Your support means the world to me.
If you find my content valuable, I would greatly appreciate it if you could share it with two of your friends who also enjoy analyzing charts. Your help in spreading the word would be amazing. Thank you to all those who share!
To subscribe to Jotting on Charts, simply click the "Subscribe now" button.
I would love to hear from you, so please get in touch with me on X.
Stay safe, and good luck out there…
GH
DISCLAIMER: The information in this report is obtained from sources that Jotting on Charts believes to be reliable, but we do not guarantee its accuracy. All of the information contained herein should be independently verified and confirmed. All opinions expressed by Jotting on Charts are for informational purposes only. Jotting on Charts is not a financial advisor. This does not constitute investment advice, nor any opinions expressed, constitute a solicitation of any securities or related financial instruments' purchase or sale. Jotting on Charts is not responsible for any losses incurred from any use of this information. Do not trade with money you cannot afford to lose. It is recommended that you consult a qualified financial advisor before making any investment decisions.









Terrific stuff Grant - and timely - thank you!