
Last week I wrote a note about why I think we can go higher moving into the final months of 2020 and this week I would like to point out some of the warning signs I can see:
Negative divergence
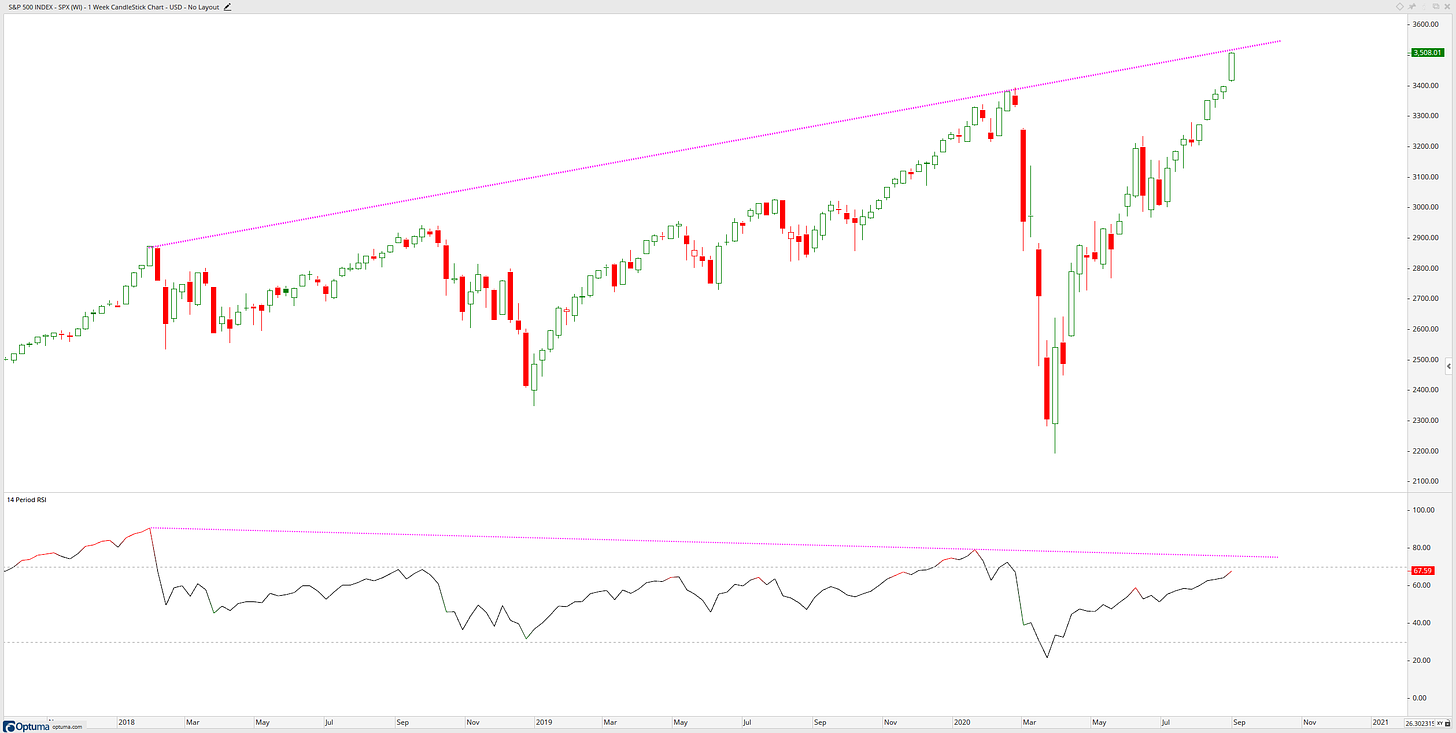
A negative divergence occurs when the underlying security moves to a new high in our case its the S&P500, but the indicator (RSI14) fails to record a new high and forms a lower high.
From the weekly chart below we can see a substantial negative divergence starting from January 2018.
There are still index laggers
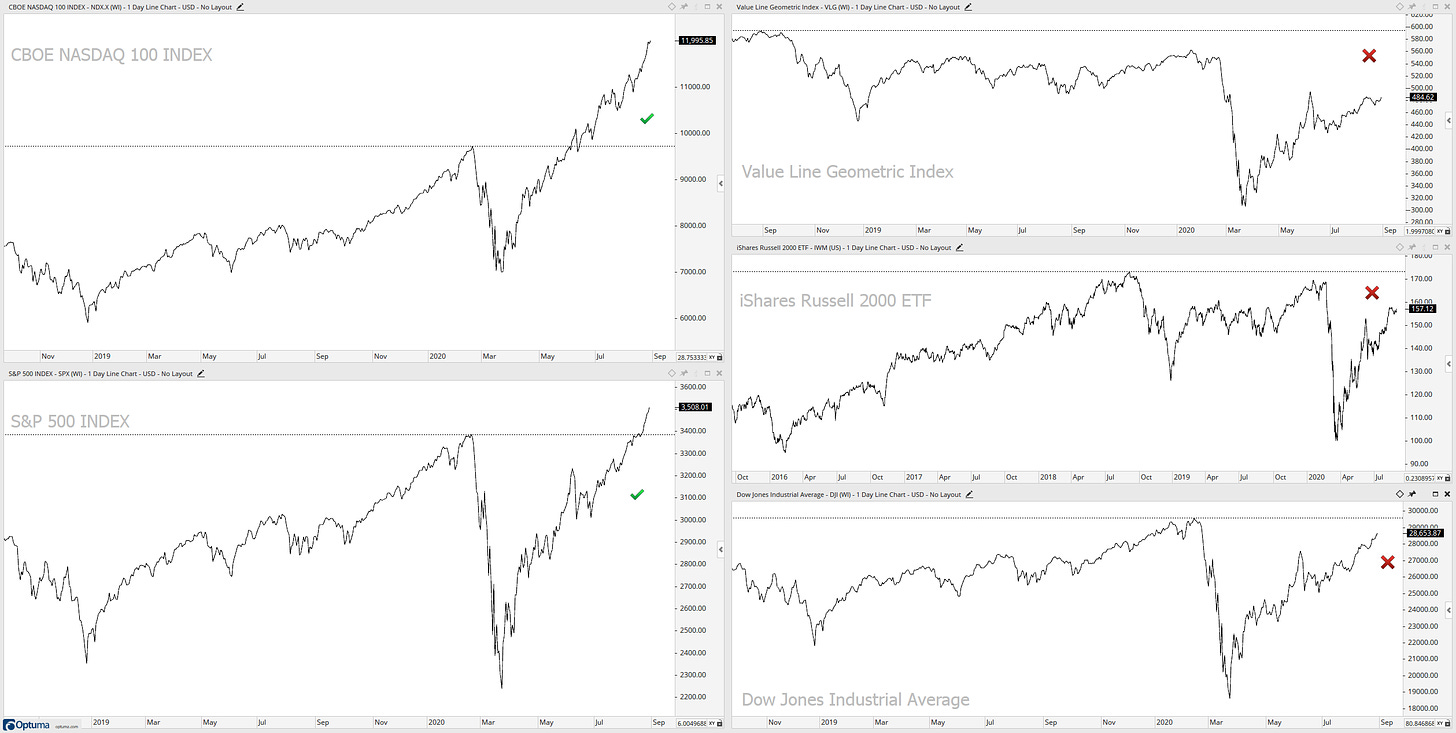
S&P500 and Nasdaq100 pushing to new all-time highs while indexes like the Dow Jones Industrials, Russell 2000 and the Value Line Geometric index are still lagging behind their previous highs.
Equal-weight still lagging
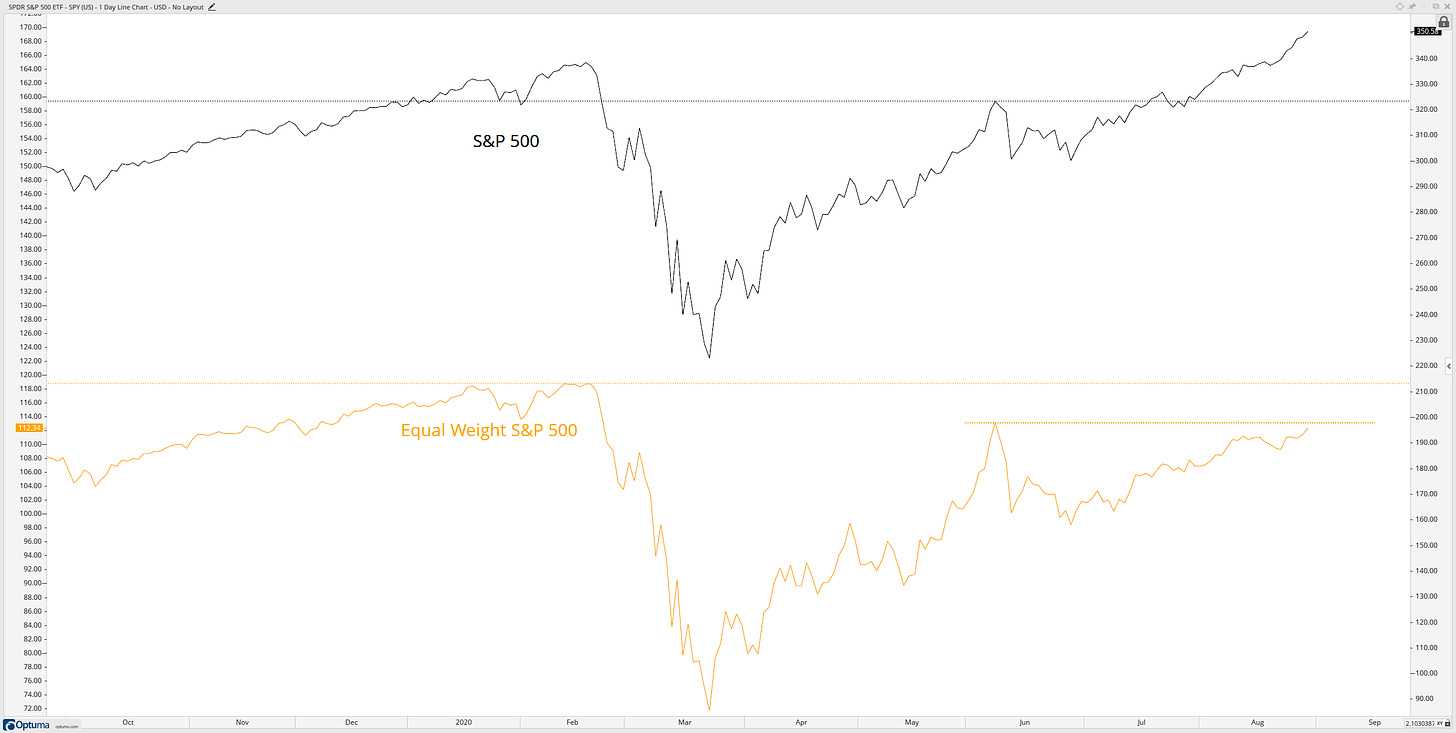
Following on from the previous theme, here is the SPY making news highs while the equal-weighted S&P 500 struggling even to get above the peak in June
Negative divergences in breadth
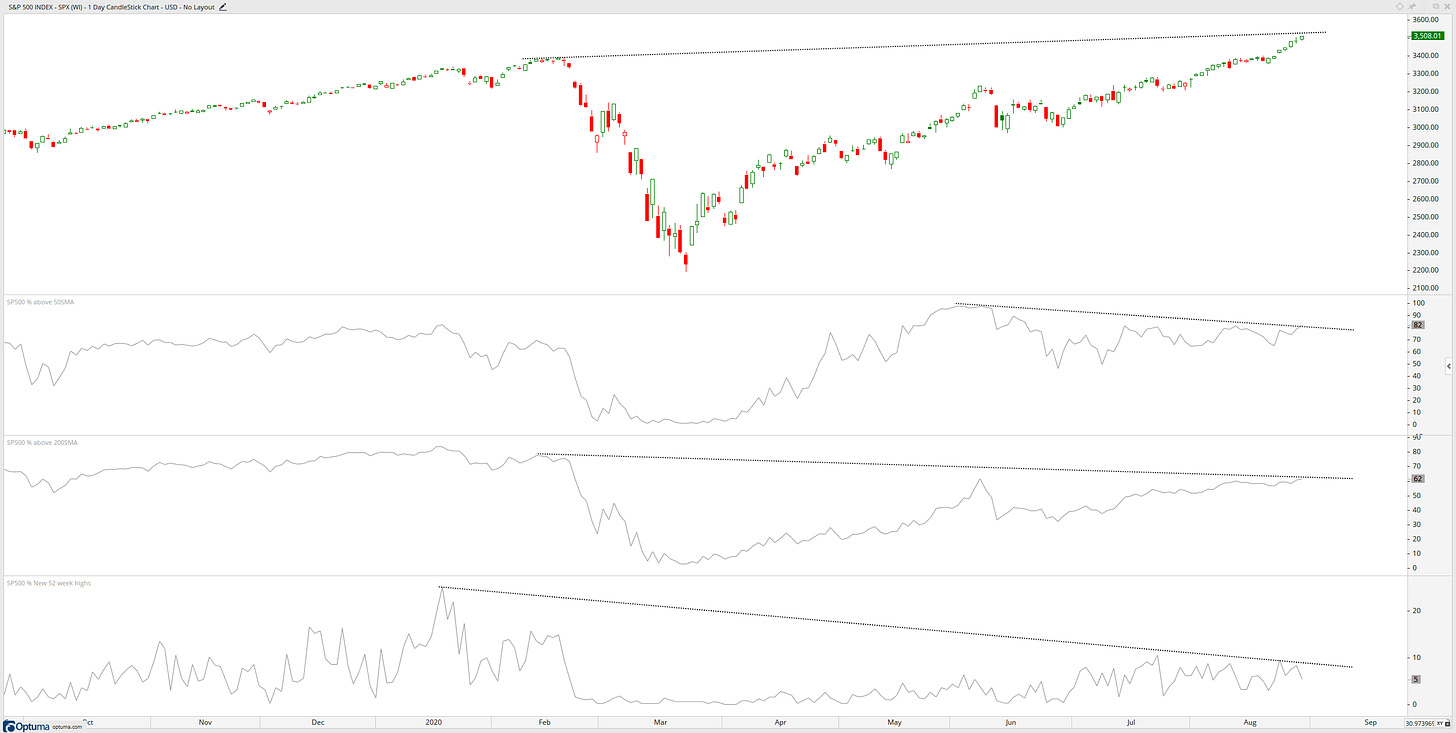
Breadth data hasn’t been as strong going into these new all-time highs and is now producing negative divergences within the S&P 500’s breadth data.
Gold with strength still
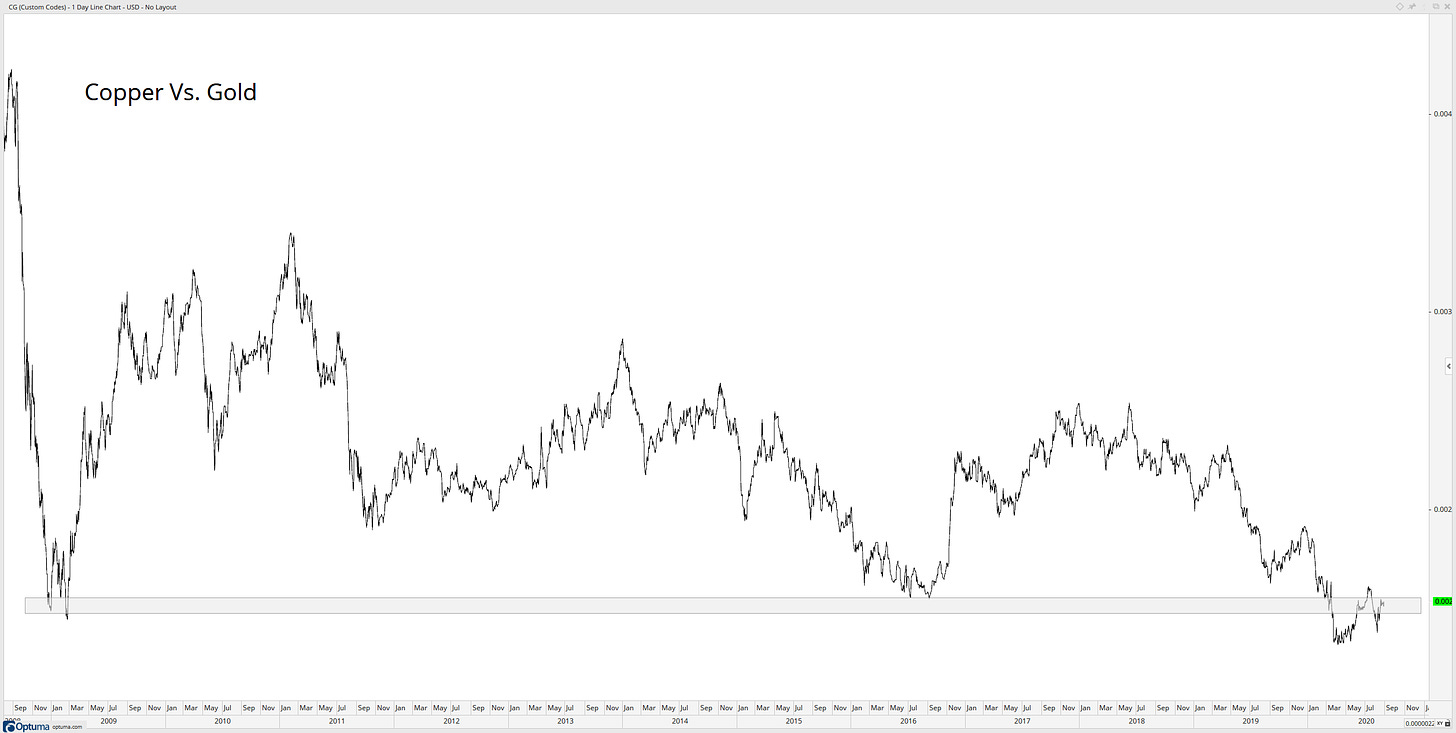
Copper goes up when sentiment is bullish and growth is improving, and Gold goes up when sentiment is bearish and growth is faltering.
For a strong market, you want this ratio moving in an upwards direction and being stuck at the 2008/09 low zone, this is not bullish for the markets.
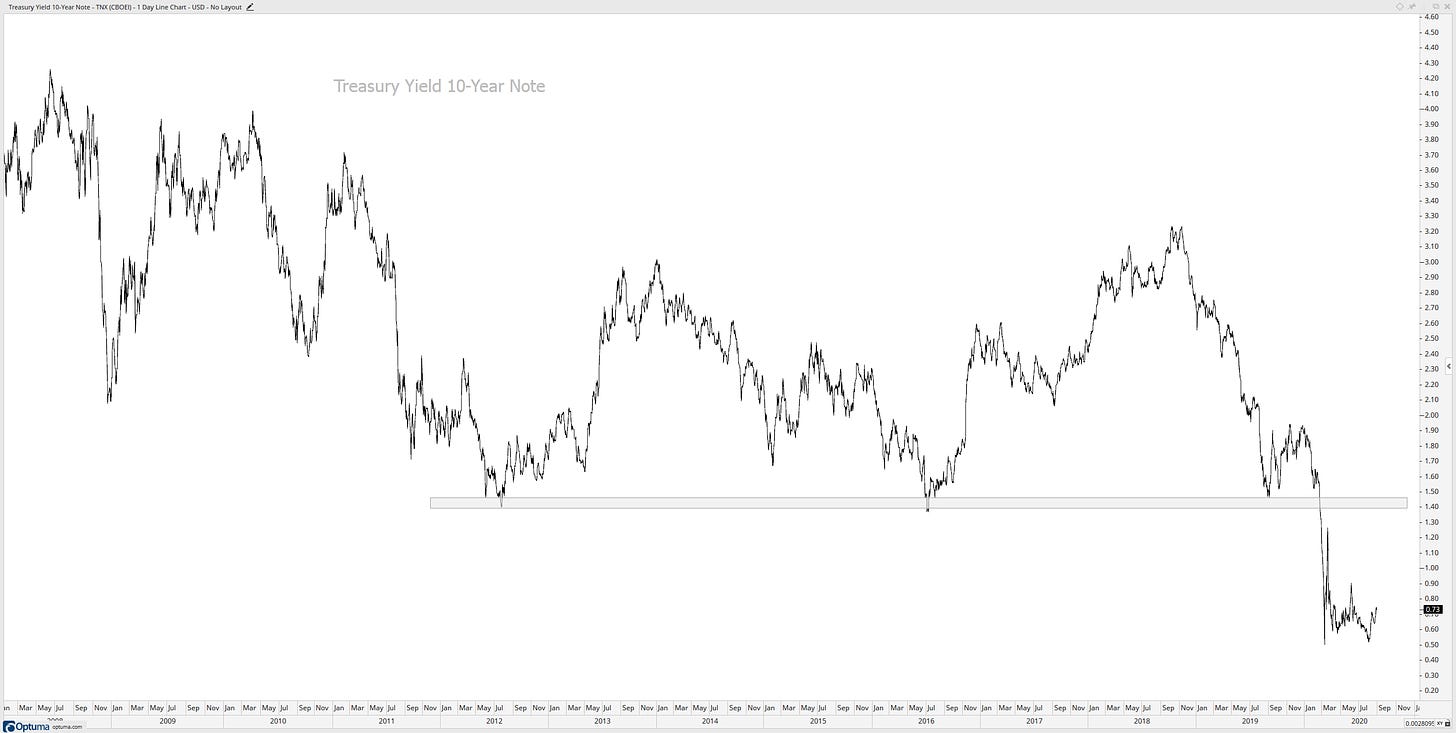
Downtrend for yields
Despite a bounce this past week in the 10-year treasury yields, it still remains super weak.
There you have it, I am still bullish on the markets, but I know which data points are throwing up warning signs so I am ready to change my thesis at any time!
So, if you have a different thesis or ideas for the current market, please share your thoughts in the comment section or get in contact with me on Twitter: @granthawkridge. The stock market always has two sides to the story… buyers and sellers, and it’s okay to switch between the two when the price/data changes.
Until next week!
Stay safe and good luck out there…
GH
DISCLAIMER: The information included in this report are obtained from sources which Jotting on Charts believes to be reliable, but we do not guarantee its accuracy. All of the information contained herein should be independently verified and confirmed. All opinions expressed by Jotting on Charts are for informational purposes only. Jotting on Charts is not a financial advisor, and this does not constitute investment advice nor any opinions expressed, constitute a solicitation of the purchase or sale of any securities or related financial instruments. Jotting on Charts is not responsible for any losses incurred from any use of this information. Do not trade with money you cannot afford to lose. It is recommended that you consult a qualified financial advisor before making any investment decisions.


