A Breadth of Fresh Air
A brief note on market breadth
Welcome to Jotting on Charts. If you’re reading my blog but haven’t subscribed, please join to learn more about uptrends, downtrends and everything in between alongside +500 other subscribers. Thank you to all who are following along on this journey!
If you share this with 2 of your friends who also like to look at charts, it will be GREATLY appreciated. Thank you to all those who share.
Breadth thrusts are NOT signs of exhaustion. They are evidence of new trends emerging.
When we get these monster bullish breadth thrusts, remember these are things we tend to see near the beginning of bull market cycles, not near the end of them.
To be clear, I believe a cluster of breadth thrusts is not a want but a need in order to signal that the next bull market has begun.
Guess what?!… we are getting that cluster!
I have been pretty obnoxious on X about the expansion in all breadth readings we currently see in the US.
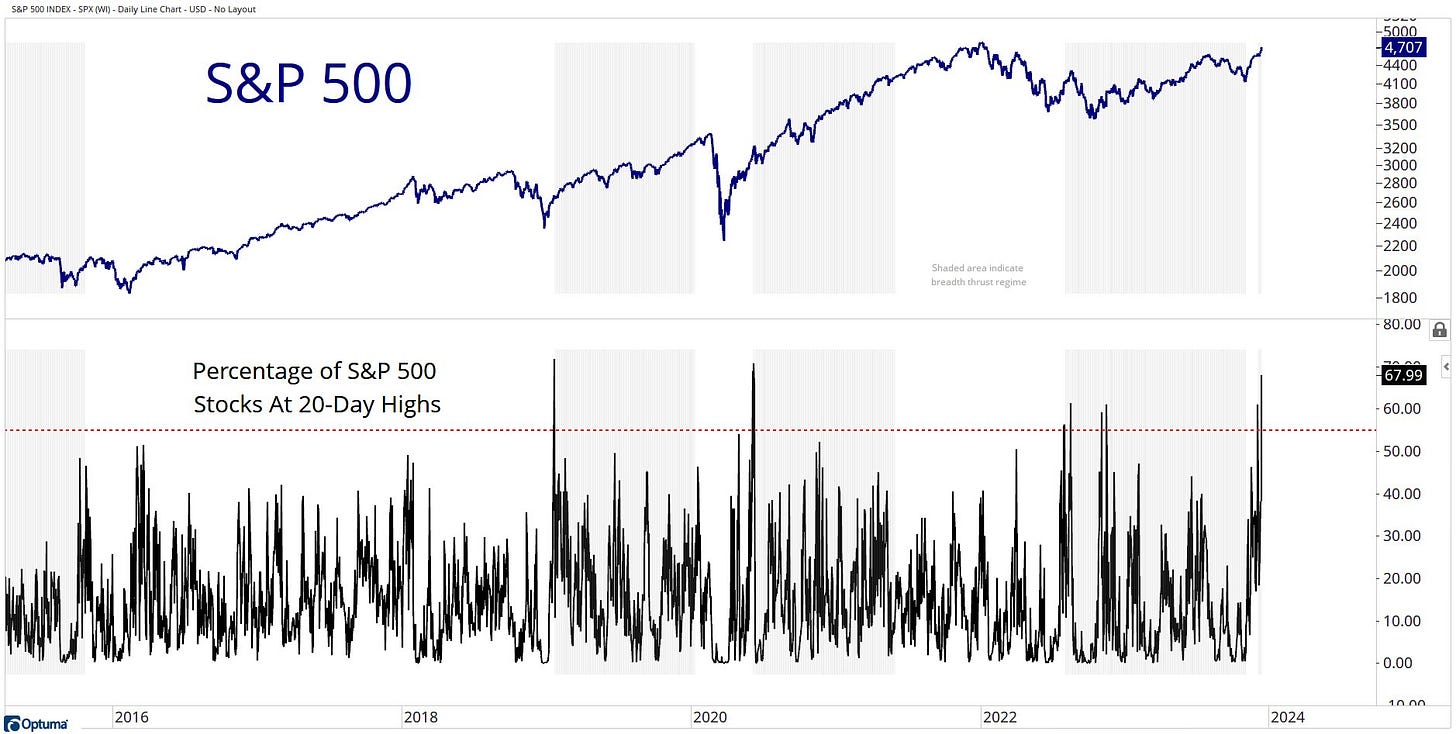
Last week, we saw more than 55% of S&P 500 stocks trading at new 20-day highs. In my work, that is a key breadth thrust:
This reading actually moved even higher this week to 68%… thats a massive move!
We also saw more than 50% of S&P 500 stocks trading at new 63-day highs this week:
This is a longer-term thrust…
Will we see this move into 6-month highs? Most likely if the stock market continues to move higher and re-test all-time highs at an index level.
Here’s another breadth reading that is thrusting… Percentage of S&P 500 stocks overbought:
44% of stocks are overbought! This is the highest read in two decades. (My data only goes back two decades)
This is not a bearish signal…. it’s bullish!
Strength generates more strength…
Change my mind?
YOU CANT!
Based on the weight of the evidence and frequency of these massive breadth readings, I am definitely leaning towards this being the beginning of a new bull market.
I will continue to monitor breadth data as it comes in each day, and I’ll update you with a blog post if necessary.
For now, I think things are looking pretty good.
My question to you… What information did you get out of my charts?
If you enjoyed this post, please consider sharing it for more people to see!
I would love to hear from you, so please get in touch with me on X @granthawkridge.
As always, stay safe and good luck out there…
Please reach out with any other questions…
GH
DISCLAIMER: The information included in this report are obtained from sources which Jotting on Charts believes to be reliable, but we do not guarantee its accuracy. All of the information contained herein should be independently verified and confirmed. All opinions expressed by Jotting on Charts are for informational purposes only. Jotting on Charts is not a financial advisor. This does not constitute investment advice, nor any opinions expressed, constitute a solicitation of any securities or related financial instruments' purchase or sale. Jotting on Charts is not responsible for any losses incurred from any use of this information. Do not trade with money you cannot afford to lose. It is recommended that you consult a qualified financial advisor before making any investment decisions.


Great information and data on breadth thrusts! I will definitely look to increase upside exposure in th enear future
What are your thoughts on the yield curve potentially un-inverting next year with the FED loosening? This historically is the effect of a recessionary environment. Do you think this will be bullish or bearish for stocks ?