I posted about US market breadth last week
This week I want to ZOOM out and focus on the world breadth!
The universe I have developed for my global market list includes 51 international indices, which I feel are the most important (22 Developed & 29 Emerging markets - Slide into my DMs on Twitter if you want to discuss more).
So let’s dig in and peek under the hood at how the international market breadth is looking…
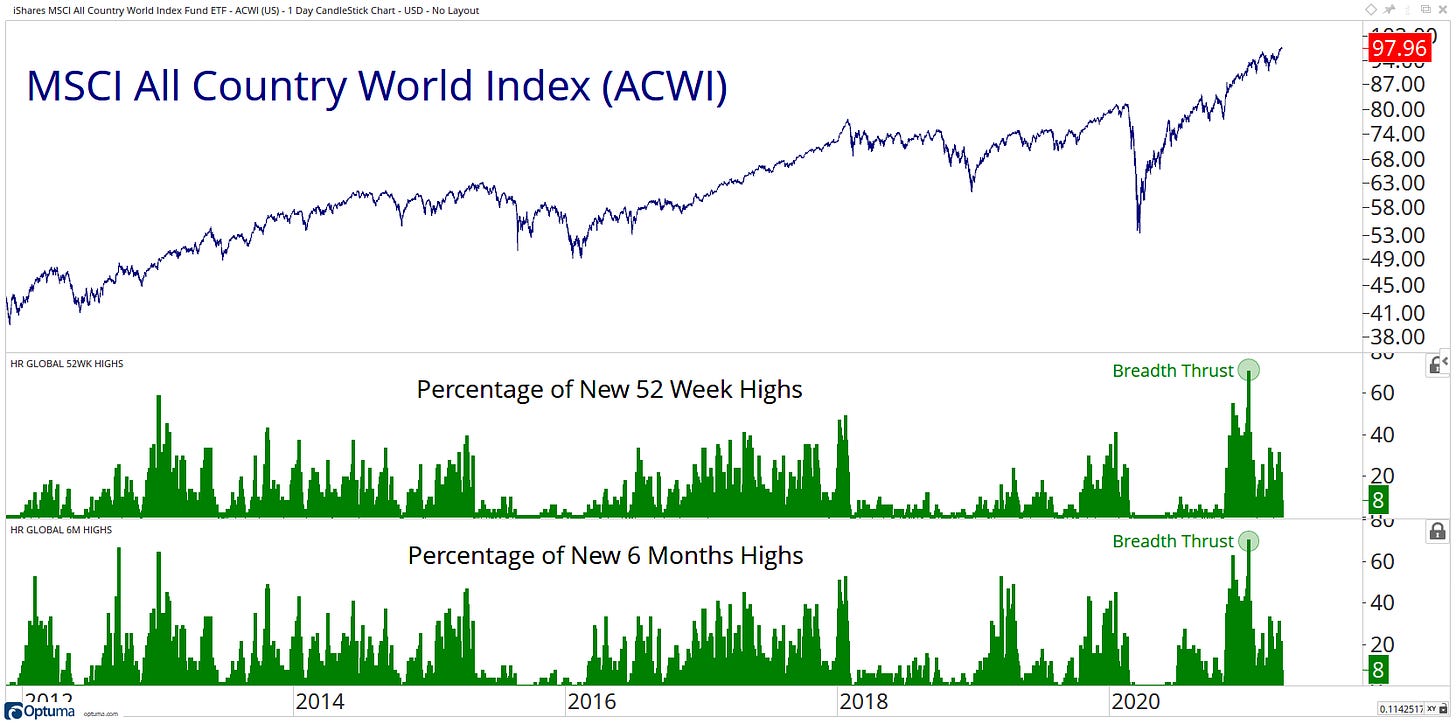
We can see that global markets posted a breadth thrust on 8th January of this year, and current leadership has continued within healthy ranges ever since.
When the markets are this healthy on the higher time frames… I switch to the lower time frames to look for expansions of new lows.
They are just not currently showing any signs of weakness in these lower time frames.
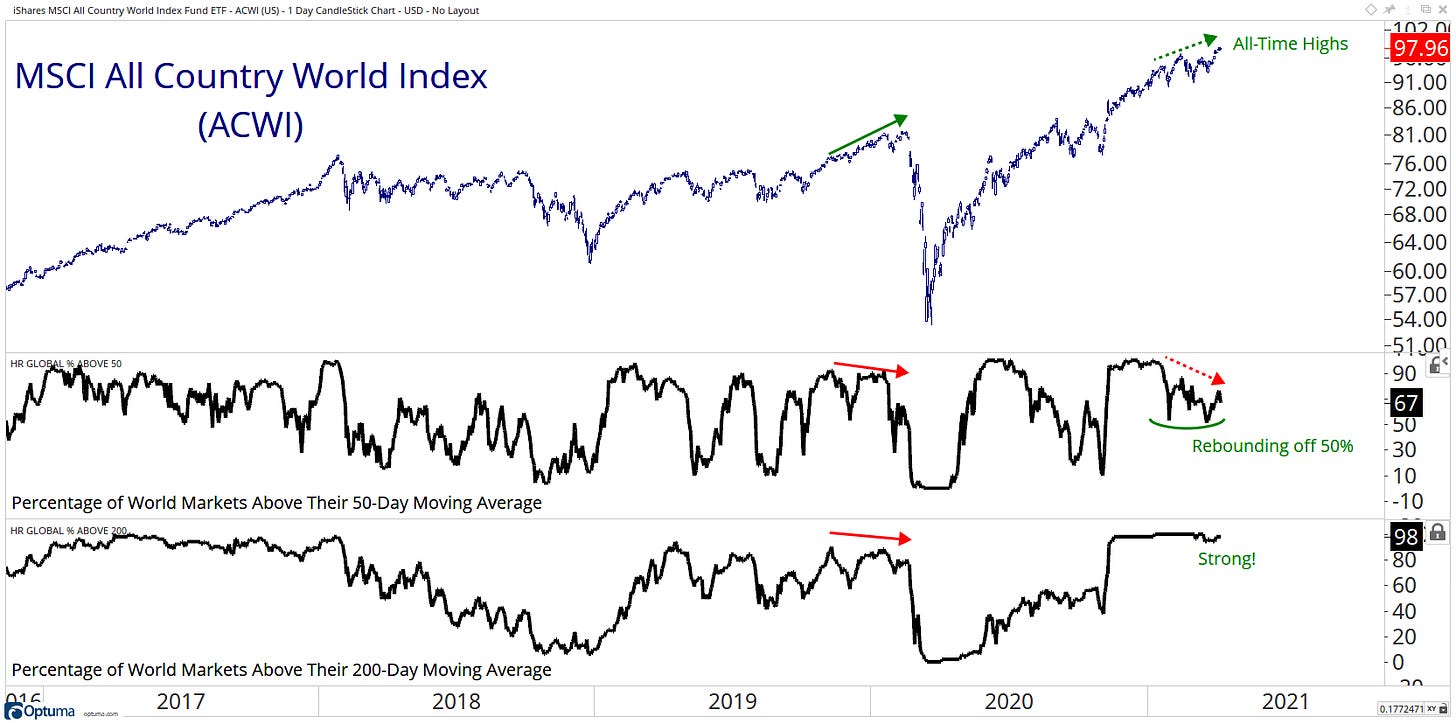
Global markets are in up trends… its just that simple!
98% are above their 200-day MA!
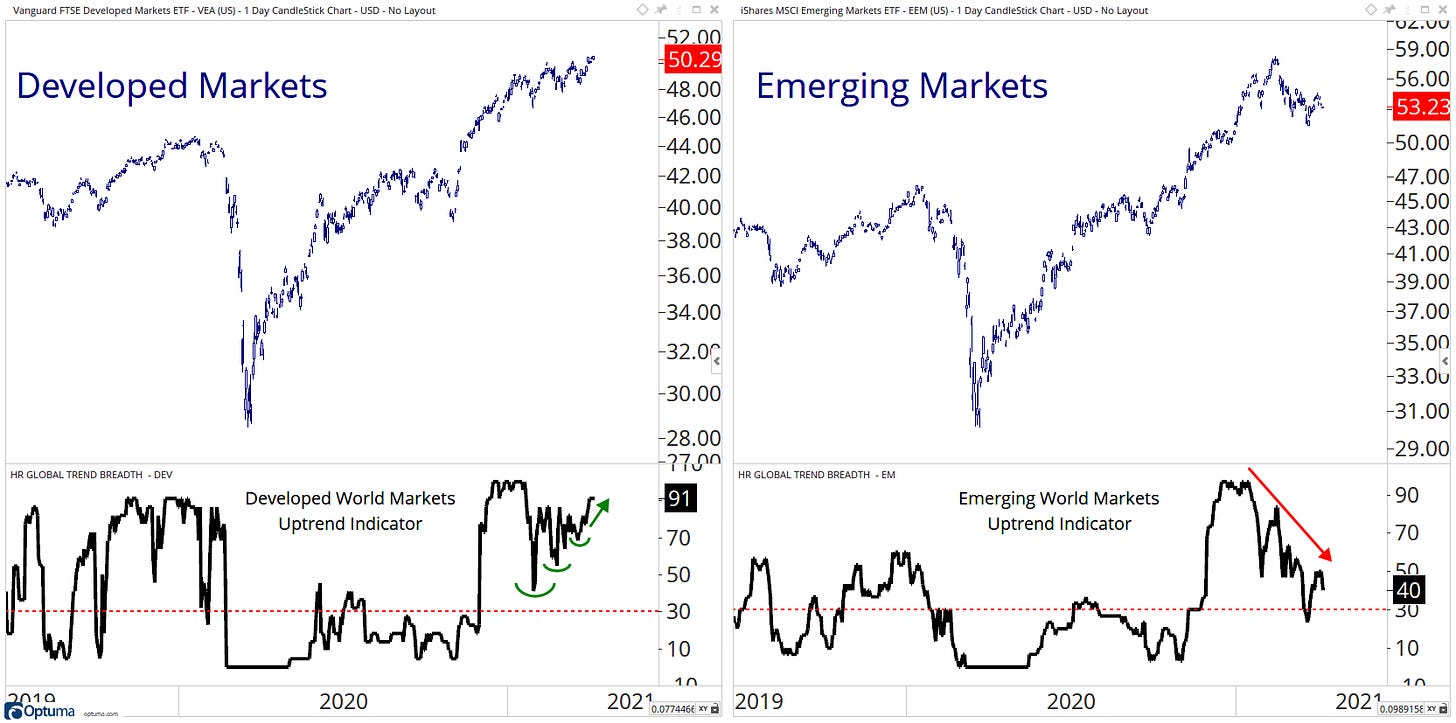
Let’s split the universe into developed and emerging groups…
91% of my developed markets are in uptrends… That what I call strength!
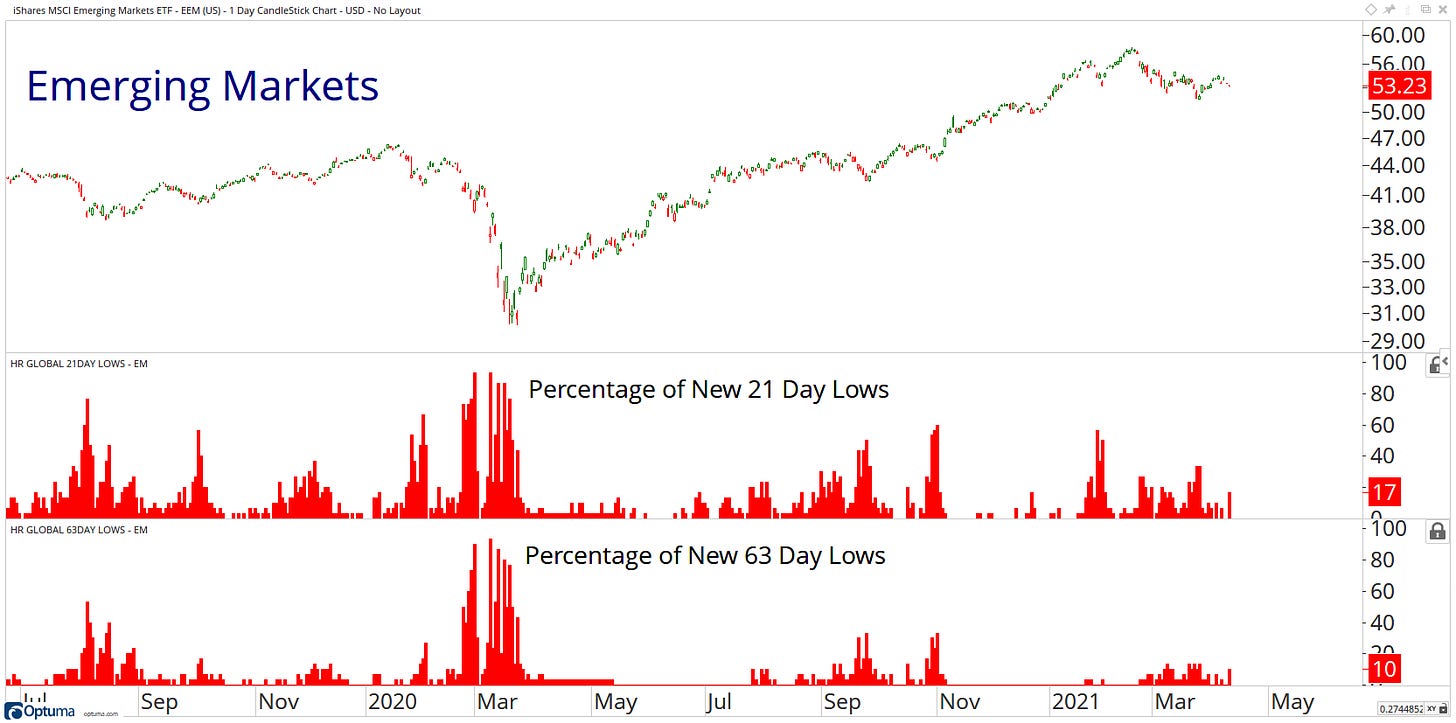
Only 40% of my emerging markets are in uptrends.
Even though we have seen emerging markets pulling back from their recent highs…
Are we witnessing any exploding expansions within the new low on the smaller time frames? NO is the answer…
The bottom line is global market breath looks healthy…
Strong leadership at the higher timeframes…
No concern from the lower timeframe lows…
Even when we are looking at the weakest areas of the global markets.
Do you agree?
Or am I completely wrong here?
Let us know your thoughts in the comment section or get in contact with me on Twitter @granthawkridge.
If you enjoyed this blog, please consider sharing for more to see!
Stay safe, and good luck out there…
GH
DISCLAIMER: The information included in this report are obtained from sources which Jotting on Charts believes to be reliable, but we do not guarantee its accuracy. All of the information contained herein should be independently verified and confirmed. All opinions expressed by Jotting on Charts are for informational purposes only. Jotting on Charts is not a financial advisor. This does not constitute investment advice, nor any opinions expressed, constitute a solicitation of any securities or related financial instruments' purchase or sale. Jotting on Charts is not responsible for any losses incurred from any use of this information. Do not trade with money you cannot afford to lose. It is recommended that you consult a qualified financial advisor before making any investment decisions.


